In a groundbreaking revelation, a report from the International Energy Agency (IEA) has highlighted a remarkable surge in global solar photovoltaic (PV) capacity additions, soaring by over 80 percent between 2022 and 2023. The report underscores a seismic shift towards renewable energy sources, with solar power leading the charge.
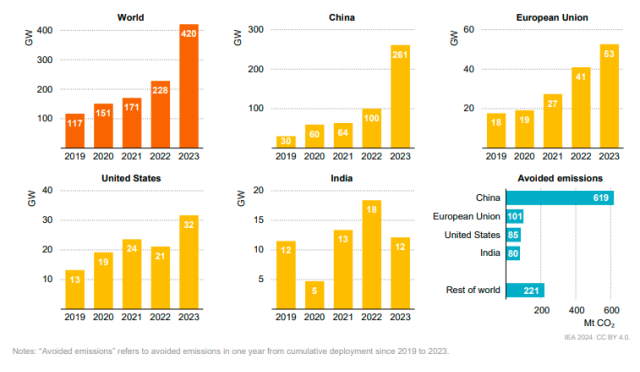
China emerges as the dominant player in this paradigm shift, accounting for over 80 percent of the global increase in solar PV capacity additions. Despite the discontinuation of central government subsidies for utility, commercial, and industrial-scale applications, China witnessed a staggering 2.5-fold growth in solar PV deployment. Remarkably, the nation contributed a groundbreaking 62 percent of global additions, buoyed by rapid manufacturing expansion resulting in a 50 percent reduction in PV module costs since December 2022. This reduction has significantly enhanced the competitiveness of solar PV against provincial benchmark electricity prices, predominantly reliant on coal power generation.
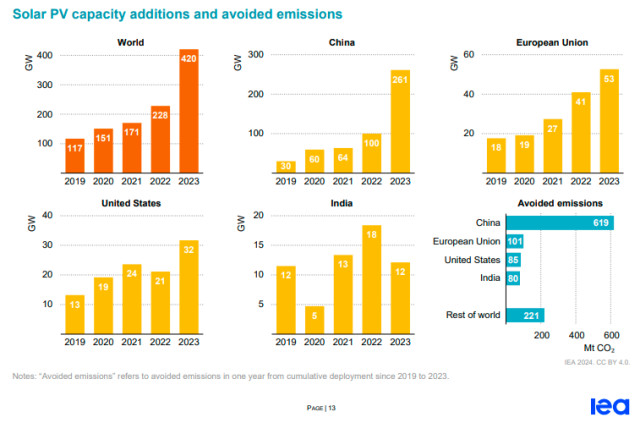
Meanwhile, in the European Union (EU), annual solar PV additions surged by a quarter, reaching a historic 52 GW in the past year. The EU member states intensified efforts to accelerate renewables deployment in the wake of Russia’s invasion of Ukraine, aiming to mitigate reliance on natural gas. Consequently, annual solar PV additions nearly doubled since 2021, with consumers swiftly embracing rooftop solar PV installations to counter soaring retail electricity prices amidst the energy crisis.
The United States witnessed a 50 percent increase in solar PV capacity additions year-on-year, following the resolution of supply chain issues that hampered growth in 2022. Federal tax incentives and state-level support continued to propel both utility-scale and rooftop solar PV applications.
In contrast, India experienced a dip in solar PV additions, recording 12 GW in 2023, one-third lower than the previous year. This decline can be attributed to reduced competitive auction volumes for utility-scale solar projects and lingering supply chain disruptions. On the other hand, Brazil’s solar PV additions surged by over 20 percent year-on-year, driven by a robust net metering scheme incentivizing rooftop solar PV installations, surpassing India’s capacity additions in 2023.
The global deployment of solar PV between 2019 and 2023 has led to a significant reduction in annual CO2 emissions, estimated at around 1.1 billion tonnes (Gt), equivalent to Japan’s total annual emissions. Notably, China stands out as the primary contributor to emissions reduction, with solar PV capacity additions averting over 600 Mt of CO2 emissions. In Australia and New Zealand, solar PV deployment during the same period mitigated emissions equivalent to 10 percent of the region’s total annual energy emissions in 2023, underscoring the pivotal role of solar energy in combating climate change.
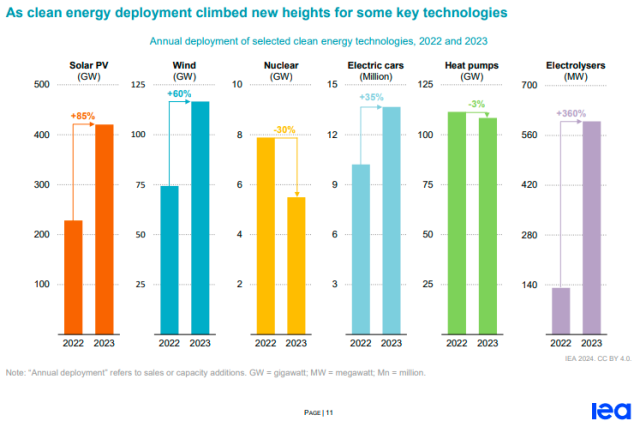
The year 2023 marked a significant milestone in the global push for clean energy, with solar photovoltaic (PV) and wind power installations experiencing remarkable growth rates of 85 percent and 60 percent respectively.
Combined, these two technologies accounted for nearly 540 gigawatts (GW) of added capacity, with China emerging as the dominant player in both sectors. However, despite this progress, clean energy deployment remained heavily concentrated in advanced economies and China, leaving much of the world trailing behind.
In 2023, China and advanced economies collectively contributed 90 percent of the capacity additions for wind and solar PV, along with over 95 percent of global electric car sales. The electric vehicle market witnessed a 35 percent surge in sales, reaching a total of 14 million vehicles, representing one in every five cars sold worldwide. Notably, China led this trend with one in every three cars sold being electric, followed by the European Union where the ratio stood at one in every four cars.
In contrast, global sales of heat pumps experienced a slight decline from the record levels seen in 2022. This dip was attributed to cautious consumer spending amidst economic pressures, coupled with some alleviation of concerns regarding high gas prices. The slowdown underscored the importance of supportive policies to assist financially strained consumers and bridge the gap between electricity and gas prices.
Nuclear capacity additions saw a decrease to 5.5 GW in 2023, although year-on-year fluctuations are less significant due to the lengthy development timelines associated with nuclear projects. Nonetheless, construction commenced on five new nuclear reactors during the year, contributing to a total of 58 reactors under construction globally at the beginning of 2024, with a combined capacity exceeding 60 GW.
Meanwhile, hydrogen electrolyser capacity witnessed a staggering 360 percent growth in 2023, albeit from a relatively low base. China led this expansion, surpassing the European Union in deployment speed. Although the United States also increased its deployment pace, annual additions remained modest compared to other regions.
Despite these advancements, energy efficiency continues to lag. Recent assessments indicate a mere 1 percent improvement in energy intensity in 2023, falling far short of the COP28 pledge to double the long-term rate of energy intensity improvement by 2030.
The momentum towards clean energy has been bolstered by Covid-19 stimulus packages since 2019, resulting in a significant acceleration of deployment. Over this period, clean energy growth outpaced that of fossil fuels by a ratio of two-to-one. Notably, low-emission electricity production increased by approximately 1,800 terawatt-hours (TWh), despite challenges such as hydro power stagnation and nuclear power declines in the European Union due to drought and forced outages. Conversely, fossil fuel-based electricity generation saw a more modest growth of slightly less than 850 TWh. In end-use sectors, the consumption of clean energy doubled that of fossil fuels.
Clean Energy Technologies
A comprehensive analysis spanning from 2019 to 2023 reveals that the deployment of five pivotal clean energy technologies — solar photovoltaic (PV), wind power, nuclear power, electric cars, and heat pumps — has resulted in substantial savings equivalent to 5 percent of global fossil fuel demand across all sectors in 2023. This remarkable achievement represents nearly the combined total energy demand of Japan and Korea from all sources during the same period.
Specifically, the deployment of these technologies has averted annual fossil fuel demand of approximately 25 exajoules (EJ). Notably, the avoided coal demand stands at approximately 580 million tonnes of coal equivalent (Mtce) annually, surpassing the actual increase in global annual coal demand from 2019 to 2023 by 30 percent.
Solar PV and wind power installations in electricity sectors globally played a significant role, with both technologies collectively averting around 320 Mtce and 235 Mtce of annual coal demand respectively —equivalent to the combined annual coal demand for electricity generation in India and Indonesia.
Furthermore, the deployment of wind and solar PV, along with contributions from heat pumps and nuclear power, resulted in the avoidance of approximately 180 billion cubic meters (bcm) of natural gas demand annually. This figure is nearly twice the actual increase in global annual natural gas demand during the same period. Notably, wind and solar PV accounted for the largest share of avoided natural gas demand, followed by heat pump deployment.
In terms of oil demand, the deployment of electric cars played a pivotal role, averting almost 1 million barrels per day (mb/d) in energy equivalent terms. Without this intervention, oil demand would have surpassed pre-pandemic levels, highlighting the critical impact of electric vehicles in reducing reliance on fossil fuels.
The collective deployment of solar PV, wind power, nuclear power, electric cars, and heat pumps during the specified period has resulted in the avoidance of approximately 2.2 billion tonnes (Gt) of emissions annually. This significant reduction has helped mitigate the increase in CO2 emissions globally, which would have otherwise been three times larger.
Solar PV emerges as a particularly potent contributor to emission reduction efforts, avoiding around 1.1 Gt of emissions annually at the global level — equivalent to Japan’s entire energy sector emissions. In specific markets like Australia and New Zealand, solar PV deployment has a profound impact, averting CO2 emissions equivalent to nearly 10 percent of the region’s total annual emissions from energy in 2023.
While wind power, nuclear, electric cars, and heat pumps contribute to emissions reduction as well, their impact is expected to increase in the coming years as technology turnover raises their share in both annual new sales and the larger total stock of equipment in use.
Baburajan Kizhakedath