Over the past decade, the LCOE (Levelized Cost Of Electricity) of renewable electricity generation technologies has dropped exponentially, driving the energy transition towards a 100% renewable system. The largest drops in LCOE since 2010 have been for onshore wind energy, 69%, solar photovoltaic energy, 89%, and offshore wind energy, 59%. This evolution of the renewable energies LCOE is expected to further drive the adoption of renewable energies.
The cost of producing one MWh of electricity with a given technology, taking into account the costs of construction, installation, financing, operation and maintenance, known as the LCOE (Levelized Cost Of Electricity), has a direct impact on the competitiveness of that technology and, consequently, on its massive deployment and the replacement of obsolete technologies.
As an electricity generation technology matures, its efficiency and the economy of scale lead its LCOE to decrease. For those technologies using non?renewable fuels (gas, coal, oil or uranium), their LCOE is also linked to the evolution of the price of their fuel and, if they are also greenhouse gas emitters, their LCOE is also affected by the cost of emission rights.
Throughout history, more efficient and lower?cost technologies have been replacing more expensive technologies as they became obsolete. Currently, there is a renewable energy revolution that is driving the energy transition. The LCOE of wind and solar energy has fallen dramatically over the past decade and the replacement of fossil technologies, whose costs are tied to the price of fuels and CO2, by renewable energies is unstoppable.
This article presents the evolution of the LCOE for the fastest growing renewable technologies over the last decade: onshore wind energy, solar photovoltaic energy and offshore wind energy. Calculating the LCOE of a technology is a complicated task. There are countless factors that affect the final cost of the electricity produced. In addition, installation and production costs can vary by project size and by country or region.
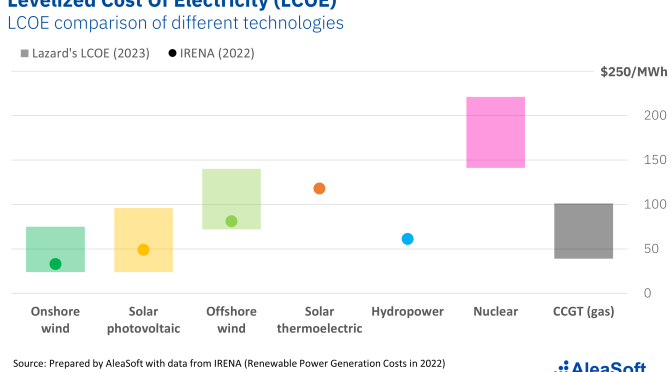
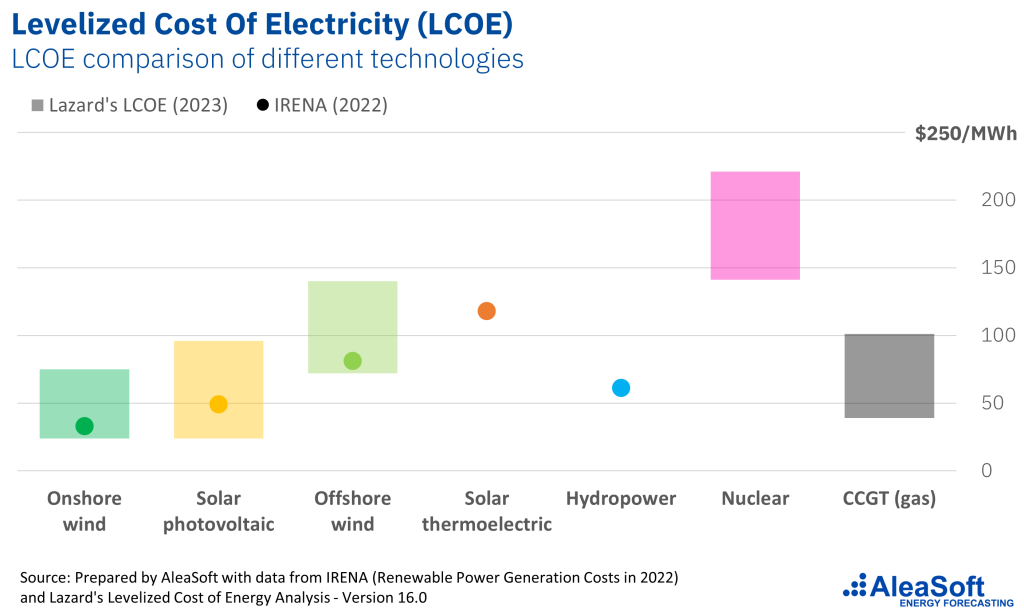
The results shown come from two sources. One is Lazard’s LCOE version 16.0, made in 2023, and the other is the cost calculated by IRENA up to last year, 2022. There are a few differences between the two sources. IRENA calculates a weighted average LCOE of projects for each technology worldwide, while Lazard’s results are more focused on projects in the United States, although they are often used as a global benchmark. In any case, the historical trend of the LCOE of renewable technologies is the same in both cases.
Onshore wind energy
The LCOE of an onshore wind farm is determined by the total installation costs, the lifetime capacity factor, the operation and maintenance costs, the economic life of the project and the capital cost. While all of these factors are important in determining a project’s LCOE, some of them have a larger impact than others. For example, the cost of the turbine and the towers is the most significant component of the total installation costs of an onshore wind energy project. Without fuel costs, capacity factor and capital cost also have a significant impact on LCOE.
According to IRENA, between 2010 and 2022, the global average LCOE for onshore wind energy fell by 69% from $107/MWh to $33/MWh. As a result of this higher competitiveness, onshore wind energy is increasingly competing with large?scale solar photovoltaic energy as the most competitive renewable technology without financial support, outperforming more mature renewable sources such as bioenergy, geothermal and hydropower.
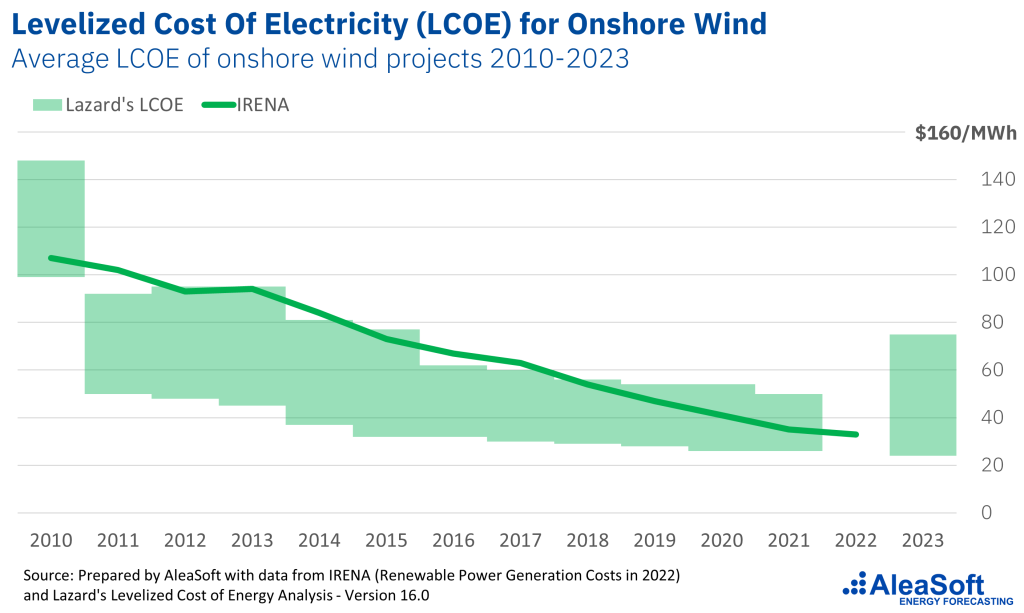
However, many countries have seen the cost of their onshore wind energy projects rise in 2022 due to rising turbine costs. In Europe, France and Germany are among the countries most impacted by this increase in costs. According to Lazard, the LCOE of onshore wind energy, but also that of solar photovoltaic energy, rose between 2021 and 2023, for the first time in its studies history due to inflation and problems in supply chains.
Solar photovoltaic energy
According to IRENA, the global weighted average LCOE for large?scale photovoltaic plants decreased by 89% between 2010 and 2022, from $445/MWh to $49/MWh. One of the main contributors to this decline in LCOE is the cost of photovoltaic modules, which has fallen by 91% over the past decade, leading to a 91% decline in photovoltaic project installation costs. These photovoltaic farm installation costs averaged $876/kW globally in 2022.
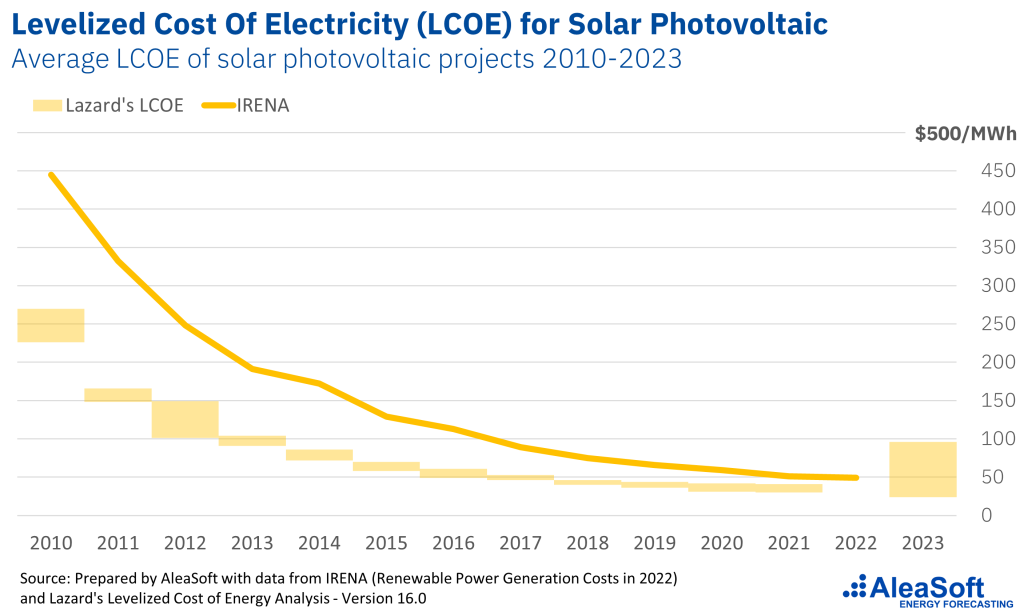
One of the features observed by IRENA is that the differences between the LCOE for photovoltaic energy in different countries around the world are decreasing from year to year. By country, China and India had the lowest LCOE in 2022, with costs of $37/MWh, which is 24% lower than the global weighted average. Australia also had competitive costs in third place at $41/MWh, followed by Chile at $42/MWh. Spain ranked fifth at $46/MWh, a decrease of 8% in 2022 compared to 2021, following an 8% increase between 2020 and 2021.
ffshore wind energy
In recent years, growing expertise and competition, advances in wind turbine technology, the establishment of optimized local and regional supply chains, and strong political and regulatory support have led to a steady stream of increasingly competitive offshore wind energy projects. Global installed offshore wind energy capacity has increased more than 20?fold over the past decade, from 3.1 GW in 2010 to 63.2 GW in 2022.
From 2010 to 2022, the global weighted average LCOE of offshore wind energy fell by 59%, from $197/MWh to $81/MWh. From its peak in 2007, the global weighted average LCOE of offshore wind energy fell by 65% to the lowest LCOE in 2021. The decline in offshore wind energy costs has been driven primarily by improvements in technology and the increasing maturity of the offshore wind energy industry.
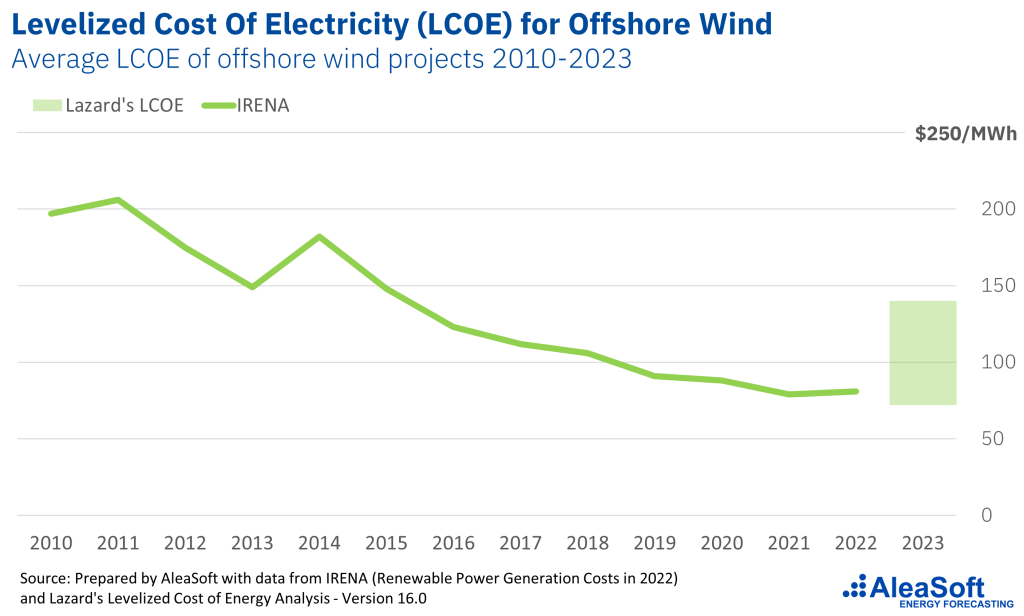
By country, in 2022, the Netherlands had the lowest weighted average LCOE at $58/MWh, surpassing Denmark, the offshore wind energy pioneer, which registered the lowest LCOE in 2021.