Concentrated solar power (CSP) saw its global weighted?average LCOE fall from 591% higher than the cheapest fossil fuel option in 2010 to 71% higher in 2022. Concentrated solar power (CSP) deployment remains disappointing, with less than 0.1 GW added in 2022 and global cumulative capacity standing at 6.5 GW at the end of 2022.

For the period 2010 to 2022, the global weighted?average cost of newly commissioned CSP projects fell from USD 0.38/kWh to USD 0.118/kWh – a decline of 69%. The LCOE of CSP fell rapidly between 2010 and 2020, despite annual volatility. Since 2020, however, the commissioning of projects that were either delayed or included novel designs has seen the global weighted?average cost of electricity from this technology stagnate. CSP would benefit from additional policy support, given the impressive cost reductions it has managed with just 6.5 GW of cumulative deployment.
Yet, although LCOE is a useful metric for a first-order comparison of the competitiveness of projects, it is a static indicator that does not take into account interactions between generators in the market. Neither does the LCOE take into account that a technology’s generation profile means that its value may be higher or lower than the average market price. As an example, CSP with thermal energy storage has the flexibility to target output during high cost periods in the electricity market, irrespective of whether the sun is shining, while solar PV’s value in the middle of the day often declines at high penetration rates (albeit, not uniformly over the year).
The LCOE also fails to take into account other potential sources of revenue or costs. For example, in some markets, hydropower and CSP with storage could earn significant revenue from providing ancillary grid services. This is not typically the case for stand-alone variable renewable technologies, however ongoing technology innovations for solar and wind technologies are making these more grid friendly. Hybrid power plants, with storage or other renewable power generation technologies, along with the creation of virtual power plants that mix generating technologies, and/or other energy system resources, can all transform the nature of variable renewable technologies.
CSP capacity expanded by 125 MW in 2022, continuing a trend of modest new capacity additions. Only one CSP plant was commissioned in 2021 and two the year before. With limited deployment, year-to-year cost changes remain volatile. Noting this caveat, the average cost of electricity from the 125 MW added in 2022 was around USD 0.118/kWh, or 2% lower than in 2021.
CSP deployment remains disappointing, with less than 0.1 GW added in 2022 and global cumulative capacity standing at 6.5 GW at the end of 2022. For the period 2010 to 2022, the global weighted average cost of newly commissioned projects fell from USD 0.38/kWh to USD 0.118/kWh – a decline of 69%. Despite the low rate of deployment, cost reductions had been clearly visible between 2010 and 2020, despite the volatility. However, since 2020, the commissioning of projects that were either delayed or included novel designs has seen the global weighted average cost of electricity stagnate. 41
Nevertheless, the above decline in the cost of electricity from CSP, which has placed it in the mid- to lower-cost range of new capacity from fossil fuels in 2022 depending on the country, remains a remarkable achievement. However, the cumulative global capacity of CSP is 161 times smaller than the capacity of solar PV installed at the end of 2022. The decline in the global weighted average LCOE of newly commissioned CSP projects has been driven by reductions in total installed costs, technology improvements, more competitive supply chains and reduced O&M costs. Improvements in technology that have seen the economic level of storage increase significantly have also played a role in increasing capacity factors.
With only a handful of projects commissioned each year in recent years, trends in the global weighted average total installed cost of CSP projects have been volatile. In 2021, the Chilean CSP plant, Cerro Dominador, was long overdue and had total installed costs of USD 9 728/kW, which placed it more in line with projects developed between 2010 and 2015. The availability of cost data for 2022 is relatively poor, but overall, the global weighted average total installed cost in 2022 was estimated to be on the order of USD 5 836/kW, with a higher degree of uncertainty than normal. The global weighted average capacity factor of newly commissioned projects declined from 80% in 2021, driven by the Cerro Dominador project’s 17.5 hours of storage, to 51% in 2022, in line with a poorer resource and around 9 hours of storage on average.
CSP, the LCOE learning rate was estimated to be 36.7%, twice the learning rate for total installed costs given the technology improvements that saw thermal energy storage costs fall and result in 9-15 hours now being the economic optimum, depending on resource quality and market circumstances, that has raised capacity factors.
Between 2010 and 2022, the global weighted average levelised cost of electricity (LCOE) of concentrating solar power (CSP) plants fell by 69%, from USD 0.380/kilowatt hour (kWh) to USD 0.118/kWh. However, only a single plant has been commissioned in 2021 and 2022, so these years are not necessarily representative.
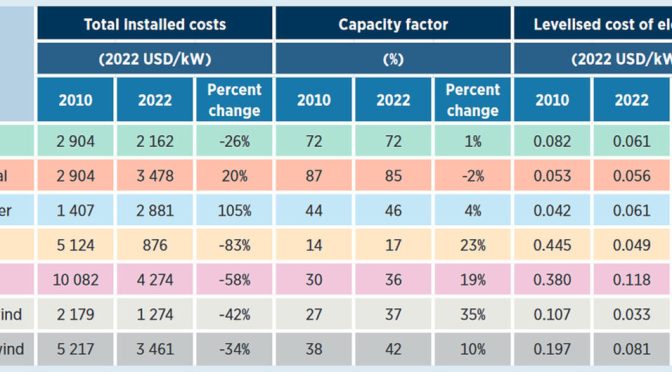
- Between 2010 and 2020, the decline in the global weighted average LCOE was primarily driven by reductions in total installed costs (down 64%), higher capacity factors (up 17%), lower operations and maintenance (O&M) costs (down 10%) and a reduction in the weighted average cost of capital (down 9%).
- Between 2010 and 2020, global average total installed costs for CSP declined by half, to USD 5 079/kilowatt (kW). This was achieved in a setting where project energy storage capacities were increasing continuously.
- During 2021, however, total installed costs increased to USD 9 728/kW – just 4% lower than in 2010. This reflected the fact that only one project came online in 2021 – a Chilean CSP scheme with 17.5 hours of storage. In 2022, another very thin market also saw only one project come online, this time in China. The total installed costs of that project were 56% lower than the 2021 value, however, at USD 4 274/kW. This also represented a 58% decline in costs compared to 2010.
- The global weighted average capacity factor of newly-commissioned CSP plants increased from 30% in 2010 to 42% in 2020, as the technology improved, costs for thermal energy storage declined and the average number of hours of storage for commissioned projects increased. The excellent solar resource in the location of the Cerro Dominador CSP project meant a very high capacity factor value for 2021, at 80%. The value for 2022 was estimated to be 36%.
CSP systems work best and have better economics in areas with a high direct normal irradiance (DNI) – that is, above 2 000 kWh/square metre (m2)/year – but can still work at lower values. CSP systems use mirrors to concentrate the sun’s rays and create heat, with most contemporary systems then transferring that heat to a heat transfer medium – typically a thermal oil or molten salt. Electricity is then generated through a thermodynamic cycle. This could be, for example, one using the heat transfer fluid to create steam and then generate electricity, as in conventional Rankine-cycle thermal power plants. Most commonly, a two-tank, molten salt storage system is used, but designs vary.
Today, CSP plants almost exclusively also include low-cost and long-duration thermal storage systems. This gives CSP greater flexibility in dispatch and the ability to target output to periods of high cost in the electricity market. Indeed, this is also usually the route to lowest-cost and highest-value electricity, because thermal energy storage is now a cost-effective way to raise CSP capacity factors.
It is possible to classify CSP systems according to the mechanism by which solar collectors concentrate solar irradiation. Such systems are either ‘line concentrating’ or ‘point concentrating’, with these terms referring to the arrangement of the concentrating mirrors.
Today, most CSP projects use line concentrating systems called parabolic trough collectors (PTCs). Typically, single PTCs consist of a holding structure with an individual line focusing curved mirrors, a heat receiver tube and a foundation with pylons. The collectors concentrate the solar radiation along the heat receiver tube (also known as an absorber), which is a thermally efficient component placed in the collector’s focal line. Many PTCs are traditionally connected in ‘loops’ through which the heat transfer medium circulates and which help to achieve scale.
Line concentrating systems rely on single-axis trackers to maintain energy absorption across the day, increasing the yield by generating favourable incidence angles of the sun’s rays on the aperture area of the collector.
Specific PTC configurations must account for the solar resources at the location and the technical characteristics of the concentrators and heat transfer fluid. That fluid is passed through a heat exchange system to produce superheated steam, which drives a conventional Rankine-cycle turbine to generate electricity.
Another type of linear-focusing CSP plant – though much less common – uses Fresnel collectors. This type of plant relies on an array of almost flat mirrors that concentrate the sun’s rays onto an elevated linear receiver above the mirror array. Unlike parabolic trough systems, in Fresnel collector systems, the receivers are not attached to the collectors, but situated in a fixed position several metres above the primary mirror field.
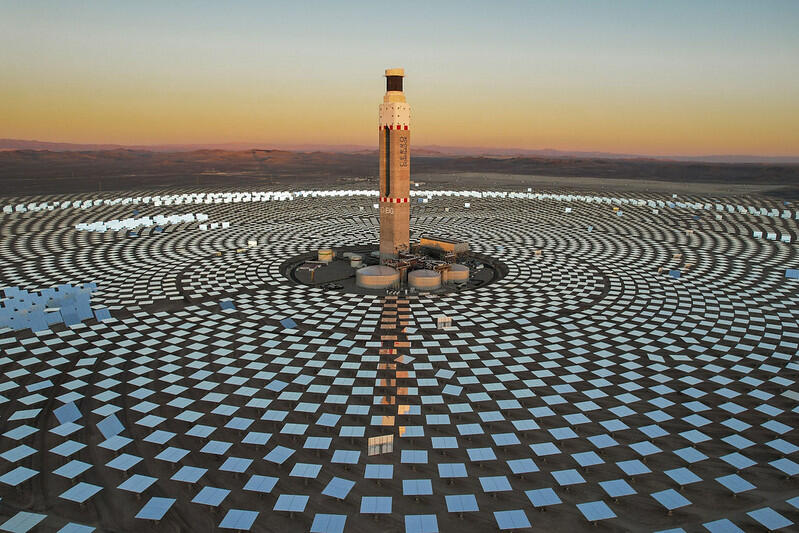
Solar towers (STs), sometimes known as ‘power towers’, are the most widely deployed point focus CSP technology, although such systems represented only around a fifth of total CSP deployment at the end of 2020 (SolarPACES, 2023). In ST systems, thousands of heliostats are arranged in a circular or semi- circular pattern around a large central receiver tower to redirect the sun’s rays towards it. 137
Each heliostat is individually controlled to track the sun, orientating constantly on two axes to optimise the concentration of solar irradiation onto the receiver, which is located at the top of a tower. The central receiver absorbs the heat through a heat transfer medium, which turns it into electricity – typically through a water-steam thermodynamic cycle. Some ST designs do away with the heat transfer medium, however, and steam is directly generated at the receiver.
STs can achieve very high solar concentration factors (above 1 000 suns) and therefore operate at higher temperatures than PTCs. This can give ST systems an advantage, as higher operating temperatures result in greater efficiencies with the steam-cycle and power block. Higher receiver temperatures also unlock greater storage densities within the molten salt tanks, driven by a larger temperature difference between the cold and hot storage tanks. Both factors cut generation costs and allow for higher capacity factors. For this reason, and the fact they represent the majority of new projects announced in China, their share may grow in coming years.
Globally, cumulative CSP installed capacity grew just over five-fold between 2010 and 2020, reaching around 6.5 gigawatts (GW) by the end of that period. Breaking the last five years of this down, after modest activity in 2016 and 2017 – with annual additions hovering around 100 megawatts (MW) per year – the global market for CSP grew in 2018 and 2019. In those years, an increasing number of projects came online in China, Morocco and South Africa. Yet, compared to other renewable power generation technologies, new capacity additions overall remained relatively low, at 860 MW per year in 2018 and 550 MW in 2019. In 2020, only 150 MW was commissioned globally, with all of this coming online in China. Hopes for growth in 2021 did not materialise, though 110 MW (all from the Cerro Dominador project) was commissioned during that year in Chile. At the same time, about 265 MW from the Solar Energy Generating Systems (SEGS) plant in the United States – in operation since the late 1980s – was retired. After limited deployment in 2022, the cumulative global installed capacity of CSP at the end of 2022 at around 6.5 GW.
The sector remains dynamic, though. China’s plans to scale up the technology domestically could provide a boost to the industry and take deployment to new levels. Yet, progress on China’s policy to build-out several commercial-scale plants to scale up a variety of technological solutions, develop supply chains and gain operating experience has proved more challenging than anticipated. Developers have struggled and some projects have been lagging. Some have found new developers, while others appear unlikely to be completed.
The outlook for 2023 is somewhat brighter, with the Noor Energy 1/DEWA IV – 100 MW tower segment in the United Arab Emirates already commercially operational since February 2023. The possibility remains high for new capacity to come online in China as well. In 2022, Spain launched an auction that included 200 MW of CSP capacity, but the auction was unsuccessful as bids where higher than the maximum allowed, in part due to the lack of indexation to inflation (Kraemer, 2022). The CSP project pipeline includes a 100 MW solar tower project with 12 hours of storage expected to come online by 2024 in South Africa. Botswana’s Ministry of Mineral Resources, Green Technology and Energy Security has initiated a pre-qualification process for participation in a 200 MW CSP tender, while Namibia has announced plans to launch a CSP tender in 2022 for between 50 MW and 130 MW of CSP capacity. In addition to this, a 300 MW project is planned to come online in 2025 in Qinghai, China.
The National Energy and Climate Plans (NECPs) of some EU member states give an indication of the potential development of the CSP project pipeline in the future. For example, Spain plans to add 5 GW and Italy 880 MW of new CSP capacity by 2030.138
TOTAL INSTALLED COSTS
In the early years of CSP plant development, adding thermal energy storage was often uneconomic and generally unwarranted, so its use was limited. Since 2015, however, hardly any projects have been built or planned without thermal energy storage. Adding this is now a cost-effective way to raise capacity factors, while it also contributes to a lower LCOE and greater flexibility in dispatch during the course of the day.
The average thermal storage capacity for solar thermal plants in the IRENA Renewable Cost Database increased from 3.5 to 11 hours between 2010 and 2020. Commissioned in 2021, the Cerro Dominador 110 MW ST project, located in Chile’s Atacama Desert, features a storage capacity of 17.5 hours. During 2022 the capacity installed in China averaged 9 hours of storage. It is likely that all new CSP projects developed worldwide will include thermal storage.
Total installed costs for both PTC and ST plants are dominated by the cost of the components that make up the solar field. Although data on the total installed cost breakdown for 2010 rely on bottom-up, techno-economic analyses (Fichtner, 2010; Hinkley, 2011), the data can be paired with IRENA’s project level installed cost to get an understanding of the total installed cost breakdown in 2010-2011 and 2019-2020.
In 2010, the solar field of a PTC plant cost an estimated USD 4 503/kW (44% of the total installed cost), but by 2020, this Figure had fallen 68% to USD 1 440/kW (30% of the total). With such a dramatic reduction in costs for the solar field, other cost areas with smaller declines saw their share of total installed costs increase. The power block’s share, for example, increased from 15% in 2010 to 19% in 2020, despite its cost falling by 40% over the same period, from USD 1 499/kW to USD 892/kW. This was also the case for the heat transfer fluid system, which increased its share from 9% to 11%, despite these costs per kW falling 47% over the 2010-2020 period, from USD 948/kW to USD 503/kW. This also occurred for thermal energy storage. That component’s share of total installed costs increased from 9% in 2010 to 15% in 2020, despite the cost itself falling from USD 873/kW to USD 706/kW. At the same time, during that period, the owner’s costs share rose from 5% to 9%, with an absolute value change from USD 465/kW to USD 427/kW.
Over the 2010 to 2020 period, the costs of the balance of plant, engineering and contingencies for PTC plants declined by 60%, 64% and 57% respectively. As a result, over the same period, the share of balance of plant in total installed costs declined from USD 626/kW (6% of the total) to USD 252/kW (5%), while engineering costs fell from USD 507/kW (5% of the total) to USD 180/kW (4%). A measure of how far the weighted average total installed costs for PTC plants have fallen is the fact that the costs of the solar field alone in 2010 were only 5% lower than the weighted average total installed cost in 2020.
For ST plants, this comparison is very similar, with 2010 heliostat field costs being only 7% lower than the ST weighted average total installed cost value in 2019. Over that decade, the reduction in the cost of the heliostat field was significant, with costs falling 70% between 2011 and 2019, from USD 5 916/kW to USD 1 768/kW. This drove down the field’s share of total installed costs from 31% to 28%. The cost of the receiver fell by 71% over the 2011 to 2019 period, from USD 3 069/kW to USD 876/kW, with the receiver’s share of total costs falling from 16% to 14%. Balance of plant and engineering saw the largest reduction, however, falling 93% over the same period, from USD 3 001/kW to USD 219/kW. This made this factor’s share of total costs fall from 16% to just 3%.
Contingencies remain an important overall cost component for STs. This is despite their costs falling by 42% between 2011 and 2019, from USD 1 520/kW to USD 878/kW. In 2019, contingencies for STs made up 14% of overall costs. For PTC plants, data for 2020 put that share at 8%. Contingencies for STs are often higher per kilowatt, as experience with STs remains relatively limited (although it has increased in recent years). However, there is still greater uncertainty over the replicability of development and construction processes for STs than there is for PTC plants. The latter have a longer commercial track record and a significantly larger number of installed projects. This may also be why owner’s costs for STs fell by only 12% between 2011 and 2019, with their share of overall costs increasing to 14% in 2019 (up from 5% in 2010).
Between 2010 and 2020, the weighted average total installed cost value for CSP plants in the IRENA Renewable Cost Database fell by around 50% to reach USD 5 079/kW. This Figure then fell to USD 4 274/kWin 2022, which represented a 58% decline from 2010.
Total installed costs increased to USD 9 728/kW in 2021, before falling back to USD 4 274/kW in 2022. This trend should be interpreted with care, however, as the 2021 value corresponds to that of the first solar power plant developed in Latin America, which was inaugurated in June that year. Taking that value into account, the total installed cost decline between 2010 and 2021 was 4%. This was despite the fact that the LCOE decline for that period stayed at a similar level to that recorded between 2010 and 2021, given the high capacity factor of the Chilean Cerro Dominador project, which boasts 17.5 hours of storage. During 2022, deployment shifted to China, and with it’s lower costs structure saw the weighted average total installed cost value fall to USD 4 274/kW.
Data from the IRENA Renewable Cost Database show that total installed costs for CSP plants declined during the last decade, even as the size of these projects’ thermal energy storage systems increased.
141 During 2018 and 2019, the installed costs of CSP plants with storage were at par or lower than the capital costs of plants without storage commissioned in the 2010 to 2014 period – sometimes even dramatically lower. The projects commissioned in 2018 and 2019 and listed in the IRENA Renewable Cost Database had an average of 7.4 hours of storage. This is 2.8 times more than the average storage value for projects commissioned between 2010 and 2014. Storage continued to grow after that, too. For instance, the weighted average storage level for projects commissioned in 2020 and 2021 was 13.8 hours, which was 85% higher than the level in 2018 and 2019.
The capital costs for CSP projects commissioned in 2020 for which cost data are available in the IRENA Renewable Cost Database ranged between USD 4 761/kW and USD 5 713/kW. That year, only two projects were completed, however. Both were in China and totalled 150 MW. So the data reflect national circumstances, much as the years 2010 to 2012 saw Spain dominate CSP deployment and therefore CSP data.
The two projects completed in China were also part of a programme of 20 pilot projects. These were designed to test a range of technology concepts and gain experience in integrating a wide range of technologies and plant configurations into the electricity system. The programme, launched in 2016 and aiming to develop 1.35 GW of capacity, initially targeted completion by 2018, but undoubtedly this timeline was too ambitious. With weighted average total installed costs of USD 5 079/kW in 2020, costs were 31% lower than the weighted average of USD 7 382/kW for projects commissioned in 2019.
During 2018 and 2019, IRENA’s Renewable Cost Database shows a capital cost range of between USD 3 571/kW and USD 9 699/kW for CSP projects with storage capacities of between four and eight hours. In the same period, the cost range for projects with eight hours or more of thermal storage capacity was narrower – between USD 4 574/kW and USD 7 774/kW.
For CSP, the determinants of the achievable capacity factor for a given location and technology are the quality of the solar resource and the technological configuration. CSP is distinctive in that the potential to incorporate low-cost thermal energy storage can increase the capacity factor45 and reduce the LCOE.
This is, however, a complex design optimisation that is driven by the desire to minimise the LCOE and/or meet the operational requirements of grid operators or shareholders in capturing the highest wholesale price.
This optimisation of a CSP plant’s design also requires detailed simulations, which are often aided by techno- economic optimisation software tools that rely increasingly on advanced algorithms. In recent years, advanced optimisation tools can easily explore simulations that consider the site’s solar resource, the project’s storage capacity and the necessary solar field size to minimise LCOE and ensure optimal utilisation of the heat generated. This is a delicate balance, as smaller than optimal solar field sizes result in under-utilisation of the thermal energy storage system and the selected power block. A larger than optimal solar field size, however, would add additional capital costs, but increase the capacity factor – albeit at the potential risk of heat generation being curtailed at times, due to lack of storage and/or power generation capacity.
Over the last decade, falling costs for thermal energy storage and increased operating temperatures have been important developments in improving the economics of CSP. The latter also lower the cost of storage, as higher heat transfer fluid (HTF) temperatures reduce storage costs. For a given DNI level and plant configuration conditions, higher HTF temperatures allow for a larger temperature differential between the ‘hot’ and ‘cold’ storage tanks. This means greater energy (and hence storage duration) can be extracted for a given physical storage size, or alternatively, less storage medium volume is needed to achieve a given number of storage hours. Combined, these factors have increased the optimal level of storage at a given location since 2010, helping minimise LCOE.
These drivers have contributed to the global weighted average capacity factor of newly-commissioned plants rising from 30% in 2010 to 42% in 2020 – an increase of 41% over the decade. The 5th and 95th percentiles of the capacity factor values for projects in the IRENA Renewable Cost Database commissioned in 2019 were 22% and 54%, respectively. In 2020, the range for both projects was from 40% to 46%. The excellent solar resource in Chile’s Atacama Desert, the location of the Cerro Dominador CSP project, meant a very high capacity factor value for 2021, at 80%. In 2022, a project located in China with 9 hours of storage drove the capacity factor to 36%, a value closer to the 2019 level.
The increasing capacity factors for CSP plants, driven by increased storage capacity, can clearly be seen. Over time, CSP projects have been commissioned with longer storage durations.
For plants commissioned from 2016 to 2020, inclusive, around four-fifths had at least four hours of storage and 39% had eight hours or more.
The impact of the economics of higher energy storage levels is evident in that in 2020, newly-commissioned plants had a weighted average capacity factor of 42%, with an average DNI that was lower than for plants commissioned during the 2010 to 2013 period. Indeed, during that period, the weighted average capacity factor for newly-commissioned plants was between 27% and 35%.
Both the early period of CSP development in Spain and the more recent one in China have been characterised by small, 50 MW projects. In China’s case, these have predominantly been technology demonstration projects among 20 initial pilot schemes. However, in order to unlock economies of scale – and as competitive procurement has encouraged greater developer choice in plant specifications – average project sizes have risen over time. It is likely that future commercial projects will gravitate towards the 100 MW to 150 MW range, which represents the economic optimum in most locations.
CSP plants are also now routinely being designed to meet evening peaks and overnight demand. CSP with low-cost thermal energy storage can integrate higher shares of variable solar and wind power, meaning that while often underrated, CSP could play an increasingly important role in the future.
The recent increase in storage capacity has also been driven by declining costs of thermal energy storage as the market has matured. This is the result of both declining capital costs and of higher operating temperatures, which allow larger temperature differentials in the molten salt storage systems, increasing the energy stored for the same volume. The result has been an increase in the weighted average number of storage hours through time. This rose more than three-fold between 2010 and 2020, from 3.5 hours to 11 hours. The Cerro Dominador project in Chile that came online in 2021 features the highest known storage capacity in the word, at 17.5 hours. In 2022 this value was nine hours, a Figure closer to the 2019 level.
Although, all else being equal, a higher DNI leads to a larger capacity factor, there is a much stronger correlation between capacity factors and storage hours. This is, however, only one part of the economics of plants at higher DNI locations. Higher DNIs also reduce the field size needed for a given project capacity and hence the size of the investment.
Yet, technology improvements and cost reductions for thermal energy storage also mean that higher capacity factors can be achieved even in areas without world class DNI. The 2020 data show the impact of higher storage levels, with newly-commissioned plants recording a weighted average capacity factor of 42% that year, even though the average DNI in 2020 was lower than for plants commissioned between 2010 and 2013, inclusive. During that earlier period, the weighted average capacity factor was between 27% and 35% for newly commissioned plants.
OPERATION AND MAINTENANCE COSTS
For CSP plants, all-in O&M costs, which include insurance and other asset management costs, are substantial compared to solar PV and onshore wind. They also vary from location to location, depending on differences in irradiation, plant design, technology, labour costs and individual market component pricing, which is linked to local cost differences.
Historically, the largest individual O&M cost for CSP plants has been expenditure on receiver and mirror replacements. As the market has matured, however, experience – as well as new designs and improved technology – have helped reduce failure rates for receivers and mirrors, driving down these costs.
In addition, personnel costs represent a significant component of O&M, with the mechanical and electrical complexity of CSP plants relative to solar PV, in particular, driving this. Insurance charges also continue to be an important further contributor to O&M costs. These typically range between 0.5% and 1% of the initial capital outlay (a figure that is lower than the total installed cost).
With some exceptions, typical O&M costs for early CSP plants still in operation today range from USD 0.02/kWh to USD 0.04/kWh. This is likely a good approximation for the current levels of O&M in relevant markets for projects built in and around 2010, globally. This is so, even if it is based on an analysis relying on a mix of bottom-up engineering estimates and best-available reported project data (IRENA, 2018; Li et al., 2015; Turchi, 2017; Zhou, Xu and Wang, 2019).
Analysis by IRENA undertaken in collaboration with the Institute of Solar Research (Das Institut für Solarforschung des Deutschen Zentrums für Luft- und Raumfahrt [DLR]) shows, however, that more competitive O&M costs are possible in a range of markets (Table 5.1). In these, projects achieved financial closure in 2019 and 2020.
The O&M costs per kWh in many of these markets are high in absolute terms, compared to solar PV and many onshore wind farms. However, they are about 18% to 20% of the LCOE for comparable projects in G20 countries. Taking this into account, the LCOE calculations in the following section reflect O&M costs in the IRENA Renewable Cost Database that declined from a capacity weighted average of USD 0.037/kWh in 2010 to USD 0.022/kWh in 2022 (41% lower than in 2010). The weighted average value has stayed flat since 2020.
With total installed costs, O&M costs and financing costs all falling as capacity factors rose, the LCOE for CSP fell significantly between 2010 and 2022. Indeed, over that period, the global weighted average LCOE of newly commissioned CSP plants fell by 69%, from USD 0.380/kWh to USD 0.118/kWh.
With deployment during the 2010 to 2012 period being dominated by Spain – and mostly comprised of PTC plant – the global weighted average LCOE by project declined only slightly, albeit within a widening range, as new projects came online. This changed in 2013, when a clear downward trend in the LCOE of projects emerged as the market broadened, experience was gained and more competitive procurement started to have an impact. Rather than technology-learning effects alone driving lower project LCOEs from 2013 onward, the shift in deployment to areas with higher DNIs during the period 2013 to 2015 also played a role.
In the period 2016 to 2019, costs continued to fall and the commissioning of projects in China became evident, with projects commissioned there in 2018 and beyond achieving estimated LCOEs of between USD 0.08/kWh and USD 0.14/kWh. In contrast, the costs for projects commissioned in 2018 and 2019 in Morocco and South Africa tended to be higher.
For projects commissioned between 2014 and 2017, their location in places with higher DNIs was a major contributor to increased capacity factors (and therefore lower LCOE values). The weighted average DNI of projects commissioned during that period, at around 2 600 kWh/m2/year, was 28% higher than in the period 2010 to 2013. As already noted, however, this was not the only driver of LCOE trends, as technological improvements saw a move towards plant configurations with higher storage capacities. CSP with low-cost thermal energy storage has shown it can play an important role in integrating higher shares of variable renewables in areas with good DNI.
In 2016 and 2017, only a handful of plants were completed, with around 100 MW added in each year. The results for these two years are therefore volatile and driven by specific plant costs. In 2016, the increase in LCOE was driven by the higher costs of the early projects in South Africa and Morocco commissioned that year. In 2017, the global weighted average LCOE fell back to the level set in 2014 and 2015.
New capacity additions then rebounded in 2018 and 2019, with at least 600 MW added in each year. In 2018, plants were commissioned in China, Morocco and South Africa, with LCOEs ranging from a low of USD 0.080/kWh in China, to a high of USD 0.249/kWh in South Africa. In contrast, 2019 saw higher LCOEs, as two delayed Israeli projects came online. Costs that year ranged from USD 0.113/kWh for a project in China to USD 0.430/kWh for the Israeli PTC project.
In 2020, deployment did not exceed 150 MW, though low capital costs for the projects occurring in China pushed down the weighted average LCOE for that year to USD 0.118/kWh. In 2021, the LCOE value was 2% higher than in 2020, at USD 0.121/kWh – although this was still 68% lower than in 2010. The 2021 figure was, however, based on a very thin market, as is the 2022 figure of USD 0.118/kWh.
Given this, the 68% decline in global weighted average LCOE of CSP over the period 2010 to 2020, showing its main constituents.
At 64%, the largest share of the decline was taken by the fall in the total installed cost of CSP plants over the period. Improvements in technology and cost reductions in thermal energy storage – which led to projects with longer storage duration being commissioned in 2020 – led to an improvement in capacity factors. This, in turn, accounted for 17% of the reduction in LCOE over the 2010 to 2020 period. Lower O&M costs accounted for 10% of the total decline in LCOE during that time, while the reduction in the weighted average cost of capital accounted for the remaining 9%. The role of increasingly experienced developers in reducing costs at every step of the development, construction and commissioning process also needs to be acknowledged.
This same analysis yields quite different results for the period 2010 to 2021, given the high total installed costs/high capacity factor structure of the 2021 project in Chile. Accounting for this results in the capacity factor being the major contributor (77%) to cost reduction between 2010 and 2021. Lower O&M costs account for a tenth of the reduction, while reductions in the global weighted average total installed costs of newly commissioned CSP plants accounted for 7%. Improvements in the weighted average cost of capital account for 6% of the total decline in LCOE over the period.
In the absence of strong policy support for CSP, the market remains small and the pipeline for new projects unambitious. This is disappointing, given the remarkable success in reducing costs since 2010, despite just 6.4 GW being deployed globally by the end of 2021. Given the growth in the competitiveness of variable renewables since 2010, the value of CSP’s ability to provide dispatchable power 24/7 in areas with high DNI at reasonable cost is only set to grow. Greater policy support would be instrumental in bringing costs down even further – and in reducing overall electricity system costs – by providing firm, renewable capacity and flexibility services to integrate very high shares of renewables.