The American Clean Power Association (ACP) released the Clean Power Quarterly Market Report | Q2 2023 today, showing that the industry installed 5,218 megawatts (MW) of utility-scale solar, wind, and storage capacity in the second quarter – representing enough clean generation to power nearly 1 million American homes and making Q2 2023 the second-highest second quarter for clean power installations. The report also finds a significant 13% increase in clean power projects under construction or in advanced development compared to the same time last year.
“Clean power installations returned to growth, with the clean energy industry logging its second-best second quarter as America forges ahead toward a clean power future,” said John Hensley, VP of Research and Analytics. “Despite persistent headwinds from regulatory, trade, and supply chain pressures, clean power project additions rebounded as developers managed through delays and worked to keep projects on schedule. To help maintain this momentum, especially as the clean power pipeline grows, we continue to urge policy makers to find bipartisan solutions to address the supply chain and federal permitting challenges obstructing America’s full job-creating clean energy potential.”
Throughout the second quarter of 2023, clean energy developers commissioned 105 clean power projects across 38 states. Solar accounted for over 50% of clean power capacity installed, with storage accounting for nearly 30%. The increase in battery storage installations from the second quarter of 2022 was notable – the segment experienced 32% growth.
Clean Power Pipeline: Projects Under Construction or in Advanced Development
Though it is still too early to observe the effects of last year’s unprecedented federal incentives on clean power installations, their preliminary influence can be observed partially via the new-build pipeline which encompasses 145,592 MW of clean power potential, representing both projects currently under construction and those in advanced development stages.
Compared to the same time last year, projects in the solar pipeline increased 16%, with solar now accounting for 59% of America’s entire clean power project pipeline. The battery storage project pipeline grew an astonishing 45%, now composing 15% of all clean power projects currently under development. Meanwhile, the wind power pipeline increased 8% quarter-over-quarter, showing its first positive change since the third quarter of 2021.
Project Delays
Project delays continue to mount with developers reporting 12 GW of new delays in the second quarter. By the end of the second quarter of 2023, accumulated project delays totaled 55 GW. On average these projects have been delayed 13 months as component procurement challenges, trade frictions, higher costs, regulatory delays, and other challenges have held up projects. Despite these delays, more than half of that capacity is expected to be online by the end of the year.
Key Highlights | Q2 2023
- Installations: The industry installed 5,218 MW of clean power in Q2 2023 – representing enough electricity to power nearly 928,000 American homes and making Q2 2023 the second-highest second quarter to date after Q2 2021.
- Pipeline: Now encompassing 145,592 MW of clean power, the development pipeline grew by 13% compared with the second quarter of 2022, and grew by 43% compared with the second quarter of 2021.
- Of the sectors, the battery storage pipeline showed the most significant increase with a 45% growth.
- Sector Snapshot: Solar led the quarter (2,740 MW), followed by battery storage (1,510 MW) and wind (968 MW).
- Delays: 35 GW of clean power expected online prior to Q3 2023 have been delayed.
- More than half of this power is still expected to come online by the end of this year.
- Power Purchase Agreements: PPA announcements have decreased by 57% compared with the Q2 2022.
- Corporate announcements fell by 63%, while utility announcements rose by 49%
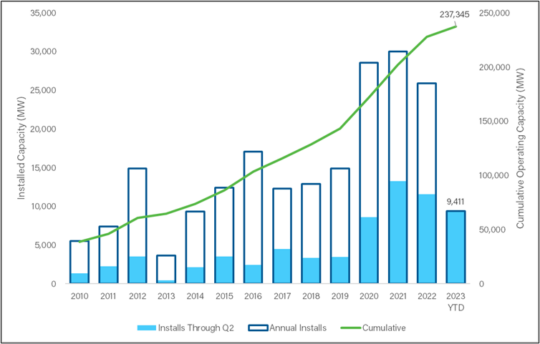
- Progress to Date: Cumulatively, operating clean power capacity in the U.S. is now more than 237 GW, accounting for 15.1% of electricity generated.
- Texas, the clean power hub, leads with 26,353 MW (18% of total operating U.S. clean power). California follows with 15,918 MW (11%), and New York ranks third with 9,085 MW (6%).
- Leading 2023 clean power installations is Florida (1,497 MW), followed by Texas (1,428 MW) and California (1,129 MW).
Download the Clean Power Quarterly Market Report | Q2 2023.