Concentrated solar power (CSP) technology is a promising renewable energy technology worldwide. However, many challenges facing this technology nowadays. These challenges are mentioned in this review study. For the first time, this work summarized and compared around 143 CSP projects worldwide in terms of status, capacity, concentrator technologies, land use factor, efficiency, country and many other factors.

Further, the various challenges facing the spread-out of this system are highlighted in terms of the heat transfer fluids (HTF), various energy storage (ES) technologies, cooling techniques, water management, and the Levelized Cost of Electricity (LCOE). Also, various thermophysical properties of the HTF are compared within the applicable range of the CSP operation. At the end of the review, various hybridization technologies for the CSP with various renewable energy sources, including photovoltaic, wind, and geothermal, are highlighted and compared. The pioneering country in using CSP, leading concentrator technology, suitable ES technology, and efficient hybrid technique based on the LCOE are determined. The analyzed data in this study is essential for predicting the future of the CSP in the markets and its contribution to reducing global warming potential.
Keywords
Concentrated solar power
Thermal energy storage
Levelized cost of electricity
Hybrid renewable energy systems
Heat transfer fluids
1. Introduction
Around 600 million people in Sub-Saharan Africa lack access to electricity, and about 940 million rely on hazardous fuels such as firewood and charcoal for cooking [1]. Most electric power generation systems do not store energy since doing so would be extremely expensive. The utilities must thus utilize more fossil fuel-burning facilities to ramp up or down as necessary to meet demand. However, this strategy is not ideal because these plants function more effectively at full power [2]. To fulfill the demand for electricity demand effectively offset the shortage of energy sources, it is advised that renewable energy systems integrated with different types of energy storage systems be implemented. Due to the projected 5.8% rise in global power consumption in 2022, large-scale renewable energy projects are being installed all over the world [3]. As a result, the percentage of renewable energy in the energy mix has increased significantly. However, additional renewable energy projects are needed to supplement or replace the lack of conventional sources of energy [4,5]. The percentage of renewables in power generation in the United States is predicted to rise by 23% by the end of 2050, as shown in Fig. 1-a. Further, Fig. 1-b shows the history and the projection of renewable energy sources in the US. It is expected that solar energy plays an important role in the US energy expected electricity production with a percentage of 51% followed by wind and hydroelectric power technologies [6,7]. Worldwide, Fig. 2 shows the electricity generation breakdown projection in 2050. It is expected that renewable energy will contribute to around 85% of global energy production. In addition, there is a great expected dependence on wind energy followed by solar PV and a slight dependence on the CSP with a percent of 4%.


Photovoltaics (PV) and wind are the most renewable energy technologies utilized to convert both solar energy and wind into electricity for several applications such as residential [8,9], greenhouse buildings [10], agriculture [11], and water desalination [12]. However, these energy sources are variable, which leads to huge intermittence and fluctuation in power generation [13,14]. To overcome this issue, researchers studied the feasibility of adding energy storage systems to this power plant [15,16]. Concentrated solar power (CSP) is a promising technology to generate electricity from solar energy. Thermal energy storage (TES) is a crucial element in CSP plants for storing surplus heat from the solar field and utilizing it when needed.
Based on the recent report by IEA, the roadmap of the CSP concluded the following: it is expected by 2050, with suitable governmental support, CSP could generate 11.3% of global electricity demand, with 9.6% from solar energy and 1.7% from backup fossil or biomass fuels. Further, all CSPs have the chance to apply thermal storage. It is also road mapped that North America is the largest producing and consuming region for CSP electricity, then Africa, India, and the Middle East. Furthermore, Northern Africa has the high potential to be an electricity seller to Europe due to the high solar irradiance, which compensates for the extra cost caused by the additional transmission lines. IEA also clarified that the CSP could be implemented in different high-temperature water desalination applications in arid countries.
One of the key challenges facing the spread of the CSP in hot arid areas is the required cooling water for the operation of the power block and mirrors cleaning. In addition, the main restriction for expanding the CSP is not the availability of the area suitable for the operation, but the far of the locations from the consumption center is another issue still facing the technical and economic concerns of the constant electricity transportation. The Levelized Cost of Electricity (LCOE) of CSP plants has been decreasing over the past several years, and by the end of 2021, the LCOE fell below 0.1$/kWh as seen in Fig. 3 reported by the International Renewable Energy Agency (IRENA).

The effectiveness of CSP plants lies in their capabilities to store large amounts of thermal energy that are collected during the day using thermal energy storage, allowing the plant to store this energy and dispatch it during the night. As a result, CSP plants can deliver power on demand, giving them an economic advantage over other renewable energy technologies [18]. In addition, resulting in 25% increase in electric power generation [19]. Since waste heat recovery has already proven useful in various other contexts [20], [21], [22], [23], it may be possible to implement it in CSP operations. The energy produced by the different renewable energy sources might be stored using a variety of energy storage systems, including; supercapacitors [24], fuel cells [25], Battery Energy Storage Systems (BESS) [26], thermal energy storage [27], compressed air systems [28] and hydropower dams [29,30].
CSP technology may have both beneficial and harmful effects on the natural environment. CSP technology has the advantage of not contributing to global warming [31], [32], [33]. CSP systems are more environmentally friendly in regions with limited access to fresh water since they use less water to operate than conventional fossil fuel power plants [34,35]. CSP systems also need less land for each unit of electricity generated as compared to other renewable energy sources like wind and solar photovoltaics [36]. The use of CSP technology does, however, have certain unintended and perhaps harmful effects on the surrounding environment. Land use and the resulting loss of habitat are a major source of damage. Large areas of land must frequently be removed for CSP systems, which may have a severe effect on the surrounding environment and wildlife habitat [37], [38], [39]. The usage of harmful materials is another possible drawback. Unsafe disposal of lead or sulfuric acid, used in certain CSP systems, may have serious consequences for human health and the environment [40,41]. Furthermore, the noise pollution created by certain CSP systems might harm surrounding wildlife [42].
The Sustainable Development Goals (SDGs) framework was developed as a response to these consequences. The framework is a collection of rules intended to encourage Renewable Energy development and operation in a way that makes it more environmentally friendly. Reducing the wasteful use of land and the loss of natural habitats are two of the framework’s primary aims. Developers are urged to make use of degraded or previously disturbed land instead of areas with ecological systems and animal habitats. As a further measure, the framework pushes for water-saving tools and methods. Developers are also urged to reduce or eliminate the usage of any potentially harmful substances. In order to reduce noise pollution, the framework also advocates for noise-reducing technology and behaviors [43].
There are many recent studies focused on CSP technologies. However, this study focuses on exploring the status and challenges facing the CSP. This can be attained by summarizing the status of 143 CSP projects worldwide in terms of capacity, concentrator technologies, land use factor, efficiency, country, and many other factors. Also, the challenges facing this technology are highlighted in terms of heat transfer fluids (HTF), energy storage (ES) technologies, cooling techniques, water management, and the Levelized Cost of Electricity (LCOE). At the end of the review, a comparison is conducted for the possible integration methods of renewable energy sources with the CSP. The impact of COVID-19 period on the installed capacity of the CSP is also presented.
2. CSP technologies, installation developments, and existing capacities
CSP technology generates electricity by concentrating solar rays into a heat absorption receiver. It has been determined that CSP-based technology is appropriate for areas with a high Direct Normal Irradiation (DNI).
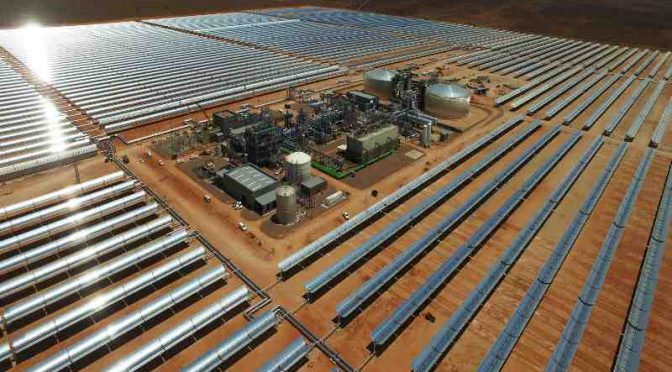
There are four most common CSP technologies available in the markets. First, parabolic trough systems which consist of parallel rows of curved high-reflectance mirrors. Sometimes it can extend to more than 100 m long. The receiver tube is made of stainless-steel pipes (called absorber tubes). These tubes are coated with a selective coating to absorb the short-wavelength or high-energy solar radiation. Due to the solar irradiance absorption, the absorber tube temperature increases; therefore, it is insulated by a vacuum layer from the atmospheric condition. Inside the absorber tubes, different types of oil are commonly used as heat transfer fluid to collect the heat and transfer it to the energy storage units and the steam generator in the Rankine cycle. Some newer plants have significant thermal storage capacities.
Second, Linear Fresnel reflectors (LFRs) Fig. (4-A), are similar to the parabolic trough, but they use linear rows of mirrors to reflect the sun rays onto a flat fixed receiver. LFR systems have a simple fixed receiver design with a low investment cost for direct steam generation. But it is less efficient than troughs in converting solar energy to electricity. Thirdly, solar towers or central receiver, Fig. (4-B), uses thousands of heliostats to concentrate the sun rays to one central receiver placed at a high level of the constructed tower. The high concentrated heat flux is used for direct steam generation, or molten salt can be used directly in the receiver. Very high temperatures can be obtained using this system. Finally, the parabolic dish CSP used a dish to concentrate the DNI to a central point. At the central point, Stirling engines are mostly used to convert the concentrated heat to useful mechanical energy then electrical energy in the generator. The whole system tracks the sun. Most dishes have an independent engine/generator (such as a Stirling machine or a micro-turbine) at the focal point. This design eliminates the need for a heat transfer fluid and for cooling water.

Fig. 5 shows the schematic layout of the CSP system using a parabolic trough. The power block, thermal energy storage, and solar field are the three primary parts of CSP systems. The solar field concentrates the sun’s rays, which are subsequently converted into thermal energy. Therefore, the heat is used to generate steam, which in turn drives the power block to generate electricity. In the case of high larger solar multiple, a high amount of heat can be captured. This heat can be stored in a thermal energy storage system. One of the most common and less expensive technology is the use of two-tank molten salt.

CSP facilities may be divided into two classes based on the types of solar collectors employed. The first is line focus technologies, which focus solar energy along a collector’s focal length, such as a parabolic trough and the linear Fresnel reflector. The second is point-focus technologies, which focus the heat of the sun on a point using devices like parabolic dishes and solar thermal towers [44,45]. The point focus CSP, such as the power tower and the parabolic dish, can be used in slopped lands. The solar field is made up of an array of mirrors or reflectors that gather and concentrate solar energy onto a receiving tube. The receiver tube absorbs heat from the focused solar radiation using a thermal energy carrier called Heat Transfer Fluid (HTF), which may then be utilized directly or in conjunction with a secondary circuit to produce electricity [46]. The solar field’s size is directly proportional to the power block’s capacity; the solar multiple is the ratio of thermal power generated by the solar field to that needed by the power block at the design point. When estimating the size of the solar field, the TES and solar multiple should be considered. Using a higher solar multiple could result in overdesigning, and using lower solar multiple results in a lower utilization of the TES because the heat produced will be reduced [47]. Therefore, optimization analysis should be done on the solar multiple and the size of TES to achieve the lowest possible LCOE and the highest Capacity Factor for the power plant [48].
The DNI, which impacts the size of the solar field, is an essential factor that must be considered while designing CSP plants. As a result of a smaller solar field being required to run the power block at its rated output due to a greater DNI, the power plant’s LCOE decreases [49]. According to the international energy agency (IEA), CSP developers set a suitable range for the operation of the CSP in areas with annual DNI from 1900 kWh/m2 to 2100 kWh/m2. Below this range of DNI, other solar electric technologies such as photovoltaic, are a competitive advantage to take advantage of both direct and diffuse irradiances. As a result, site selection is crucial to the design. According to Fig. 6, the MENA region, Spain, South Africa, Australia, and the South-West of the United States all displayed the highest DNI values.

2.1. Global CSP projects
Several CSP projects have been deployed across the world, there are more than 143 projects worldwide, with 114 in operation, 20 now non-operational or decommissioned, and 9 under construction to begin operations in 2022 and 2023 were summarized here in this study. Spain, the United States, and China are the leading countries in the construction and the operation of CSP plants; Spain has the most installed capacity with more than 2.3 GW and 51 projects built around the country, all of which are operational. Since the beginning of CSP, the US has implemented more than 26 projects around the country, although only 1.5 GW of capacity is operational. Meanwhile, China has 596 MW of installed capacity, and several projects are still under construction. Fig. 7 compares the installed capacity for each country worldwide, including all power plants currently under construction. Table 1 shows all the projects around the world. (This information was obtained from National Renewable Energy Laboratory “NREL” official website). Also, the data given in the figure are based on this data.

Table 1. CSP projects worldwide. (Source: Solarpaces, the National Renewable Energy Laboratory).
| Power plant | Location | Lat. | Long. | Solar irradiation (kWh/m2.year) | Capacity (MW) | Solar field Area (m2) | Technology | Status | Start year |
|---|---|---|---|---|---|---|---|---|---|
| ISCC Hassi R’mel | Algeria | 33.12 | 3.35 | 2159 | 20 | 183,860 | Parabolic Trough | Operational | 2011 |
| Jemalong | Australia | ?33.4 | 148.1 | – | 1.1 | 15,000 | Power Tower | Operational | 2017 |
| Lake Cargelligo | Australia | ?33.31 | 146.4 | – | 3 | 6080 | Power Tower | Non-Operational | 2011 |
| Liddell | Australia | ?32.37 | 150.9 | – | 3 | 18,490 | Linear Fresnel | Non-Operational | 2012 |
| Solar Heat and Power Liddell | Australia | ?32.37 | 150.9 | – | 1 | – | Linear Fresnel | Non-Operational | 2004 |
| Sundrop | Australia | ?32.59 | 137.8 | – | 1.5 | 51,505 | Power Tower | Operational | 2016 |
| City of Medicine Hat ISCC | Canada | 50.04 | ?110.7 | – | 1.1 | 5248 | Parabolic Trough | Operational | 2014 |
| Atacama I / Cerro Dominador | Chile | ?22.77 | ?69.47 | 3186 | 110 | 1484,000 | Power Tower | Operational | 2021 |
| Badaling Dahan | China | 40.38 | 115.93 | 1290 | 1 | 10,000 | Power Tower | Operational | 2012 |
| CEEC Hami | China | 43.61 | 94.95 | 1789 | 50 | 696,751 | Power Tower | Operational | 2019 |
| CEIC Dunhuang | China | – | – | 1649 | 100 | – | Linear Fresnel | Under Construction | 2023 |
| CGN Delingha | China | 37.35 | 97.27 | 1950 | 50 | 620,000 | Parabolic Trough | Operational | 2018 |
| CSNP Urat | China | 41.50 | 108.58 | 2170 | 100 | 1150,000 | Parabolic Trough | Operational | 2020 |
| Huaqiang TeraSolar | China | 41.21 | 114.5 | – | 15 | 170,000 | Linear Fresnel | Operational | 2018 |
| Huidong | China | – | – | – | 110 | – | Beam-Down Tower | Under Construction | 2023 |
| Jinta Zhongguang | China | – | – | – | 100 | – | Power Tower | Under Construction | 2023 |
| Lanzhou Dacheng Dunhuang | China | 40.08 | 94.42 | 1786 | 10 | – | Linear Fresnel | Operational | 2016 |
| Lanzhou Dacheng Dunhuang | China | 40.08 | 94.42 | 1649 | 50 | 1270,000 | Linear Fresnel | Operational | 2019 |
| LuNeng Haixi | China | 36.39 | 95.22 | 1945 | 50 | 610,000 | Power Tower | Operational | 2019 |
| Power China Qinghai Gonghe | China | 36.10 | 100.6 | 1883 | 50 | 516,000 | Power Tower | Operational | 2020 |
| Shouhang Dunhuang Phase I | China | 40.08 | 94.43 | 1777 | 10 | 175,375 | Power Tower | Operational | 2016 |
| Shouhang Dunhuang Phase II | China | 40.06 | 94.42 | 1777 | 100 | 1400,000 | Power Tower | Operational | 2018 |
| SUPCON Delingha | China | 37.36 | 97.29 | 2043 | 10 | 63,000 | Power Tower | Operational | 2013 |
| SUPCON Delingha | China | 37.36 | 97.29 | 2043 | 50 | 542,700 | Power Tower | Operational | 2018 |
| Yumen Xinneng / Xinchen | China | 40.33 | 97.27 | 1641 | 50 | 208,240 | Beam-Down Tower | Operational | 2021 |
| Aalborg CSP-Brønderslev | Denmark | 57.25 | 9.98 | 1025 | 5.5 | 26,929 | Parabolic Trough | Operational | 2016 |
| ISCC Kuraymat | Egypt | 29.27 | 31.24 | 2154 | 20 | 130,800 | Parabolic Trough | Operational | 2011 |
| Augustin | France | 42.50 | 1.97 | 1800 | 0.3 | 400 | Linear Fresnel | Operational | 2012 |
| eLLO | France | 42.46 | 2.06 | 1930 | 9 | 153,000 | Linear Fresnel | Operational | 2019 |
| Jülich | Germany | 50.91 | 6.38 | 902 | 1.5 | 17,650 | Power Tower | Operational | 2008 |
| ACME | India | 28.18 | 73.24 | – | 2.5 | 16,222 | Power Tower | Operational | 2011 |
| Dadri ISCC | India | 28.57 | 77.63 | 1223 | 14 | 33,000 | Linear Fresnel | Operational | 2019 |
| Dhursar | India | 26.78 | 72.00 | 1742 | 125 | – | Linear Fresnel | Operational | 2014 |
| Godawari | India | 27.60 | 72.22 | 1667 | 50 | 392,400 | Parabolic Trough | Operational | 2013 |
| KVK Energy Solar | India | 27.38 | 71.77 | 1940 | 100 | – | Parabolic Trough | Non-Operational | 2013 |
| Megha | India | 14.94 | 77.68 | 1476 | 50 | 366,240 | Parabolic Trough | Operational | 2014 |
| National Solar Thermal Power Facility | India | 28.42 | 77.15 | – | 1 | 8000 | Parabolic Trough | Operational | 2012 |
| Ashalim Plot A | Israel | 30.96 | 34.68 | 2393 | 110 | 4000,000 | Parabolic Trough | Operational | 2019 |
| Ashalim Plot B | Israel | 30.96 | 34.72 | 2393 | 121 | 1052,480 | Power Tower | Operational | 2019 |
| SEDC | Israel | – | – | – | 6 | – | Power Tower | Operational | 2006 |
| Archimede | Italy | 37.13 | 15.21 | 1936 | 4.7 | 31,860 | Parabolic Trough | Operational | 2010 |
| ASE Demo Plant | Italy | 42.73 | 12.52 | 1527 | 0.4 | 3398 | Parabolic Trough | Operational | 2013 |
| Partanna MS-LFR | Italy | – | – | 1800 | 4.26 | 83,200 | Linear Fresnel | Under Construction | 2022 |
| Rende | Italy | 39.37 | 16.24 | – | 1 | 9780 | Linear Fresnel | Operational | 2014 |
| Stromboli | Italy | – | – | 1800 | 4 | – | Linear Fresnel | Under Construction | – |
| Shagaya | Kuwait | 29.13 | 47.01 | – | 50 | – | Parabolic Trough | Operational | 2019 |
| Agua Prieta II | Mexico | 31.32 | ?109.5 | – | 12 | 85,000 | Parabolic Trough | Operational | 2017 |
| Airlight Energy Ait-Baha Pilot Plant | Morocco | 30.21 | ?9.14 | 2200 | 3 | 6159 | Parabolic Trough | Operational | 2014 |
| ISCC Ain Beni Mathar | Morocco | 34.06 | ?2.1 | 2072 | 20 | 183,120 | Parabolic Trough | Operational | 2011 |
| NOOR I | Morocco | 30.99 | ?6.86 | 2497 | 160 | 1308,000 | Parabolic Trough | Operational | 2015 |
| NOOR II | Morocco | – | – | 2503 | 200 | 1779,900 | Parabolic Trough | Operational | 2018 |
| NOOR III | Morocco | 31.06 | ?6.87 | 2508 | 150 | 1312,000 | Power Tower | Operational | 2018 |
| ISCC Duba 1 | Saudi Arabia | 27.74 | 35.45 | 2469 | 43 | – | Parabolic Trough | Under Construction | 2023 |
| ISCC Waad Al Shamal | Saudi Arabia | 31.63 | 38.87 | 2521 | 50 | – | Parabolic Trough | Operational | 2018 |
| Ilanga I | South Africa | ?28.49 | 21.54 | 2937 | 100 | 869,800 | Parabolic Trough | Operational | 2018 |
| Kathu Solar Park | South Africa | ?27.73 | 23.06 | 2830 | 100 | – | Parabolic Trough | Operational | 2019 |
| Bokpoort | South Africa | ?28.74 | 21.99 | 2949 | 50 | 588,600 | Parabolic Trough | Operational | 2016 |
| KaXu Solar One | South Africa | ?28.90 | 19.62 | 2963 | 100 | 800,000 | Parabolic Trough | Operational | 2015 |
| Khi Solar One | South Africa | ?28.53 | 21.07 | 2952 | 50 | 576,800 | Power Tower | Operational | 2016 |
| Redstone | South Africa | – | – | – | 100 | 850,000 | Power Tower | Under Construction | 2023 |
| Xina Solar One | South Africa | ?28.89 | 19.59 | 2960 | 100 | – | Parabolic Trough | Operational | 2018 |
| Andasol 1 | Spain | 37.23 | ?3.07 | 2260 | 50 | 510,120 | Parabolic Trough | Operational | 2008 |
| Andasol 2 | Spain | 37.23 | ?3.07 | 2260 | 50 | 510,120 | Parabolic Trough | Operational | 2009 |
| Andasol 3 | Spain | 37.22 | ?3.06 | 2260 | 50 | 510,120 | Parabolic Trough | Operational | 2011 |
| Arcosol 50 | Spain | 36.66 | ?5.83 | 2007 | 50 | 510,120 | Parabolic Trough | Operational | 2011 |
| Arenales | Spain | 37.16 | ?5.54 | 2064 | 50 | 510,120 | Parabolic Trough | Operational | 2013 |
| Aste 1A | Spain | 39.17 | ?3.23 | 2104 | 50 | 510,120 | Parabolic Trough | Operational | 2012 |
| Aste 1B | Spain | 39.17 | ?3.26 | 2104 | 50 | 510,120 | Parabolic Trough | Operational | 2012 |
| Astexol II | Spain | 38.81 | ?7.05 | 2055 | 50 | 510,120 | Parabolic Trough | Operational | 2012 |
| Borges Termosolar | Spain | 41.52 | 0.8 | 1878 | 22.5 | 183,120 | Parabolic Trough | Operational | 2012 |
| Casablanca | Spain | 39.23 | ?5.31 | 2064 | 50 | 510,120 | Parabolic Trough | Operational | 2013 |
| CRS | Spain | – | – | – | 5 | 10,560 | Power Tower | Operational | 2012 |
| Enerstar | Spain | 38.72 | ?0.92 | 1992 | 50 | 339,506 | Parabolic Trough | Operational | 2013 |
| Extresol 1 | Spain | 38.65 | ?6.73 | 2096 | 50 | 510,120 | Parabolic Trough | Operational | 2010 |
| Extresol 2 | Spain | 38.65 | ?6.73 | 2096 | 50 | 510,120 | Parabolic Trough | Operational | 2010 |
| Extresol 3 | Spain | 38.65 | ?6.73 | 2096 | 50 | 510,120 | Parabolic Trough | Operational | 2012 |
| Gemasolar | Spain | 37.56 | ?5.33 | 2072 | 20 | 304,750 | Power Tower | Operational | 2011 |
| Guzmán | Spain | 37.15 | ?5.27 | 2064 | 50 | 310,406 | Parabolic Trough | Operational | 2012 |
| Helioenergy 1 | Spain | 37.58 | ?5.11 | 2159 | 50 | 300,000 | Parabolic Trough | Operational | 2011 |
| Helioenergy 2 | Spain | 37.58 | ?5.11 | 2068 | 50 | 300,000 | Parabolic Trough | Operational | 2012 |
| Helios I | Spain | 39.24 | ?3.47 | 2092 | 50 | 300,000 | Parabolic Trough | Operational | 2012 |
| Helios II | Spain | 39.24 | ?3.47 | 2092 | 50 | 300,000 | Parabolic Trough | Operational | 2012 |
| Ibersol Ciudad Real | Spain | 38.64 | ?3.97 | 2042 | 50 | 287,760 | Parabolic Trough | Operational | 2009 |
| La Africana | Spain | 37.75 | ?5.05 | 2062 | 50 | 550,000 | Parabolic Trough | Operational | 2012 |
| La Dehesa | Spain | 38.95 | ?6.46 | 2069 | 50 | 552,750 | Parabolic Trough | Operational | 2011 |
| La Florida | Spain | 38.81 | ?6.82 | 2086 | 50 | 552,750 | Parabolic Trough | Operational | 2010 |
| La Risca | Spain | 38.82 | ?6.82 | 2085 | 50 | 352,854 | Parabolic Trough | Operational | 2009 |
| Lebrija 1 | Spain | 37.00 | ?6.04 | 2065 | 50 | 412,020 | Parabolic Trough | Operational | 2011 |
| Majadas I | Spain | 39.96 | ?5.74 | 2086 | 50 | 372,240 | Parabolic Trough | Operational | 2010 |
| Manchasol 1 | Spain | 39.18 | ?3.30 | 2107 | 50 | 510,120 | Parabolic Trough | Operational | 2011 |
| Manchasol 2 | Spain | 39.18 | ?3.31 | 2107 | 50 | 510,120 | Parabolic Trough | Operational | 2011 |
| Morón | Spain | 37.14 | ?5.47 | 2068 | 50 | 380,000 | Parabolic Trough | Operational | 2012 |
| Olivenza 1 | Spain | 38.81 | ?7.05 | 2053 | 50 | 402,210 | Parabolic Trough | Operational | 2012 |
| Orellana | Spain | 38.99 | ?5.54 | 2074 | 50 | 405,500 | Parabolic Trough | Operational | 2012 |
| Palma del Río I | Spain | 37.64 | ?5.25 | 2064 | 50 | 372,240 | Parabolic Trough | Operational | 2011 |
| Palma del Río II | Spain | 37.64 | ?5.25 | 2064 | 50 | 372,240 | Parabolic Trough | Operational | 2010 |
| Planta Solar 10 | Spain | 37.44 | ?6.25 | 2076 | 11 | 75,000 | Power Tower | Operational | 2007 |
| Planta Solar 20 | Spain | 37.442 | ?6.25 | 2076 | 20 | 150,000 | Power Tower | Operational | 2009 |
| Puerto Errado 1 | Spain | 38.27 | ?1.6 | 1996 | 1.4 | 48,562* | Linear Fresnel | Operational | 2009 |
| Puerto Errado 2 | Spain | 38.27 | ?1.6 | 1996 | 30 | 302,000 | Linear Fresnel | Operational | 2012 |
| Solaben 1 | Spain | 39.22 | ?5.39 | 2076 | 50 | 300,000 | Parabolic Trough | Operational | 2013 |
| Solaben 2 | Spain | 39.22 | ?5.39 | 2076 | 50 | 300,000 | Parabolic Trough | Operational | 2012 |
| Solaben 3 | Spain | 39.22 | ?5.39 | 2076 | 50 | 300,000 | Parabolic Trough | Operational | 2012 |
| Solaben 6 | Spain | 39.22 | ?5.39 | 2076 | 50 | 300,000 | Parabolic Trough | Operational | 2013 |
| Solacor 1 | Spain | 37.95 | ?4.49 | 2042 | 50 | 300,000 | Parabolic Trough | Operational | 2012 |
| Solacor 2 | Spain | 37.95 | ?4.49 | 2042 | 50 | 300,000 | Parabolic Trough | Operational | 2012 |
| Solnova 1 | Spain | 37.44 | ?6.25 | 2076 | 50 | 300,000 | Parabolic Trough | Operational | 2009 |
| Solnova 3 | Spain | 37.44 | ?6.25 | 2076 | 50 | 300,000 | Parabolic Trough | Operational | 2009 |
| Solnova 4 | Spain | 37.44 | ?6.25 | 2076 | 50 | 300,000 | Parabolic Trough | Operational | 2009 |
| Termesol 50 | Spain | 36.66 | ?5.84 | 2007 | 50 | 510,120 | Parabolic Trough | Operational | 2011 |
| Termesol 1 | Spain | 39.19 | ?5.57 | 2077 | 50 | 523,200 | Parabolic Trough | Operational | 2013 |
| Termesol 2 | Spain | 39.19 | ?5.57 | 2077 | 50 | 523,200 | Parabolic Trough | Operational | 2013 |
| Thai Solar Energy 1 | Thailand | 14.33 | 99.70 | – | 5 | 45,000 | Parabolic Trough | Operational | 2012 |
| Greenway CSP | Turkey | 36.86 | 34.61 | – | 1.4 | – | Power Tower | Operational | 2012 |
| Noor Energy 1 | United Arab Emirates | 24.76 | 55.36 | 1967 | 100 | – | Power Tower | Under Construction | 2022 |
| Noor Energy 1 | United Arab Emirates | 24.76 | 55.36 | 1967 | 600 | – | Parabolic Trough | Under Construction | 2022 |
| Shams 1 | United Arab Emirates | 23.57 | 53.71 | 2019 | 100 | 627,840 | Parabolic Trough | Operational | 2013 |
| Crescent Dunes | United States | 38.23 | ?117.3 | 2734 | 110 | 1197,148 | Power Tower | Operational | 2015 |
| Genesis | United States | 33.66 | ?114.9 | 2676 | 250 | 1928,320 | Parabolic Trough | Operational | 2014 |
| Holaniku | United States | 19.71 | ?156.0 | – | 2 | 15,378 | Parabolic Trough | Non-Operational | 2009 |
| Ivanpah | United States | 35.55 | ?115.4 | 2768 | 377 | 2600,000 | Power Tower | Operational | 2014 |
| Kimberlina | United States | 35.56 | ?119.1 | – | 5 | 25,988 | Linear Fresnel | Non-Operational | 2008 |
| Maricopa | United States | 33.55 | ?112.2 | – | 1.5 | – | Dish | Non-Operational | 2010 |
| Martin Next Generation | United States | 27.05 | ?80.56 | 1799 | 75 | 464,908 | Parabolic Trough | Operational | 2010 |
| Mojave | United States | 35.01 | ?117.3 | 2888 | 280 | 1559,347 | Parabolic Trough | Operational | 2014 |
| National Solar Thermal Test Facility | United States | – | – | – | 5 | – | Power Tower | Operational | 1976 |
| Nevada Solar One | United States | 35.8 | ?114.9 | 2625 | 72 | 357,200 | Parabolic Trough | Operational | 2007 |
| Saguaro | United States | 32.54 | ?111.2 | – | 1 | 10,340 | Parabolic Trough | Non-Operational | 2006 |
| Sierra SunTower | United States | 34.73 | ?118.1 | – | 5 | 27,670 | Power Tower | Non-Operational | – |
| Solana | United States | 32.91 | ?112.9 | 2784 | 250 | 2200,000 | Parabolic Trough | Operational | 2013 |
| Solar Electric Generating Station I | United States | 34.86 | ?116.8 | 2885 | 13.8 | 82,960 | Parabolic Trough | Decommissioned | 1984 |
| Solar Electric Generating Station II | United States | 34.86 | ?116.8 | 2885 | 30 | 190,338 | Parabolic Trough | Decommissioned | 1985 |
| Solar Electric Generating Station III | United States | 35.01 | ?117.5 | 2987 | 30 | 230,300 | Parabolic Trough | Decommissioned | 1985 |
| Solar Electric Generating Station IV | United States | 35.01 | ?117.5 | 2987 | 30 | 230,300 | Parabolic Trough | Decommissioned | 1985 |
| Solar Electric Generating Station IX | United States | 35.03 | ?117.3 | 2893 | 80 | 483,960 | Parabolic Trough | Operational | 1990 |
| Solar Electric Generating Station V | United States | 35.01 | ?117.5 | 2987 | 30 | 250,500 | Parabolic Trough | Decommissioned | 1989 |
| Solar Electric Generating Station VI | United States | 35.01 | ?117.5 | 2987 | 30 | 188,000 | Parabolic Trough | Decommissioned | 1989 |
| Solar Electric Generating Station VII | United States | 35.01 | ?117.5 | 2987 | 30 | 194,280 | Parabolic Trough | Decommissioned | 1989 |
| Solar Electric Generating Station VIII | United States | 35.03 | ?117.3 | 2893 | 80 | 464,340 | Parabolic Trough | Decommissioned | 1989 |
| Solar One | United States | 34.87 | ?116.8 | 2885 | 10 | 72,650 | Power Tower | Decommissioned | 1982 |
| Solar Two | United States | 34.87 | ?116.8 | 2885 | 10 | – | Power Tower | Decommissioned | 1995 |
| Stillwater GeoSolar | United States | 39.54 | ?118.5 | – | 2 | – | Parabolic Trough | Operational | 2015 |
| Tooele Army Depot | United States | 40.50 | ?112.3 | – | 1.5 | – | Dish | Non-Operational | – |
Based on the data from Table 1, the most utilized technology is parabolic trough collectors (PTC), with 91 projects, followed by solar thermal towers with 34 projects, linear Fresnel reflectors with 16 projects, and just two dish projects, both of which are decommissioned. Around 75% of installed capacity utilized the PTC technology. Furthermore, the linear Fresnel reflectors technology was found to have the largest land usage factor among the other technologies. However, the needed solar field area per 1 MW of capacity was found to be roughly 11,000 m2 for both linear Fresnel and Power Tower.
Fig. 8 depicts the number of projects completed each year since 2004. It can be seen that in 2012, more than 25 CSP projects were installed. While the Covid-19 pandemic may have had a detrimental impact on the deployment of CSP plants, with around 7 projects completed during that period (2020 to 2022). However, this sector is expected to recover, with around 5 projects with a combined capacity of more than 1.1 GW set to begin operations within the next few months. Fig. 9 displays the total installed capacity for each technology for 141 different power plants. The figure shows a high potential of the use of parabolic trough CSP compared to the other systems.


Further, Fig. 10, Fig. 11 compare the land use factor for 81 power plants and the average solar field area required in m2 per 1 MW of capacity for 110 power plants; respectively. The lowest land use factor is attained for a power tower central receiver with a ratio of around 18.6% followed by the parabolic trough CSP with a percent around 25%. The highest land use factor is attained by the LFL CSP with a percent around 45.5%. It is also can be concluded that the CSP with a parabolic trough needs around 8504 m2 for every 1 MW only for the solar field.


According to Trieb et al. [50] in 2009, the land usage factor ranges for linear Fresnel, parabolic trough, and power tower are (60 to 80%), (25 to 40%), and (20 to 25%), respectively. However, according to the NREL statistics in Table 1, all linear Fresnel projects were below that range, and just 23.5% of power tower projects were within it. Meanwhile, 60% of parabolic trough-based projects were determined to be within the range. This difference may be result of the progress of technology in recent years. The total solar to electricity efficiency of the parabolic trough, LFL, and central receiver ranges from 11?16%, 8?12%, and 12?16%, respectively.
2.2. Heat transfer fluids (HTF)
To collect the heat from the solar field, heat transfer fluid (HTF) should be used. The HTF significantly influence the effectiveness and performance of CSP. A CSP plant necessitates a significant amount of HTF to run, thus, it’s important to keep HTF costs down while increasing its efficiency. The HTF can transfer the heat to the power block or the TES tanks. A HTF should have the following desired properties: low melting point, high boiling point, thermal stability, low vapor pressure (1 atm) at high temperature, low corrosion with metal alloys used to hold the HTF, low viscosity, high thermal conductivity, high heat capacity for energy storage, and inexpensive [51,52].
Heat transfer fluids utilized in CSP technologies include air, water, molten salts, glycol-based, glycerol-based, and synthetic oils. These days, air and water are rarely utilized since heating air causes it to expand in volume, requiring a larger heat exchanger to be constructed for effective heat transmission, which raises the investment cost. Water oxidizes fast at high temperatures, which can cause the absorber tube materials to react and produce corrosion in the interior regions of the tube. The additional fluids available are employed at different working temperatures. Fluids based on glycol are utilized for applications below 175 °C, whereas synthetic fluids are used for applications beyond 400 °C [53]. Organic materials are also employed as HTFs. In commercial CSP systems, for example, biphenyl/diphenyl oxide is often employed. Therminol and Dowtherm fluids are commercially available Biphenyl/Diphenyl oxide HTFs. There are now eight solar thermal plants in the world that use Biphenyl/Diphenyl oxide, all of which are situated in Spain. This Biphenyl/Diphenyl oxide has a recommended operating temperature range of 12–393 °C.
In large CSP plants, air is a very infrequent HTF. Only one commercial-scale system has been developed, a 1.5 MWe solar tower pre-commercial plant in Jülich, Germany, that commenced operating in 2009. Air offers superior flow qualities inside CSP pipes when compared to other liquid HTFs such as molten salts or liquid metals. Even while air has a lower thermal conductivity than molten salts or liquid metals, its greater flow feature provides an added benefit for efficient heat transmission [54].
Water steam-based single-fluid solar thermal systems, such as direct steam generation (DSG) parabolic troughs, have been researched and developed since the 1980s, when alternatives to oil-based technologies were investigated [55]. If the HTF is not water/steam, the thermal energy gathered at the receiver is conveyed by the non-water based HTF to the steam generator and then transferred to the working fluid (often water/steam). Working fluid then transports the energy to the turbine, which generates electricity. Feldhoff et al. [56] demonstrated that direct steam generation systems using water/steam as the only fluid had an 11% lower Levelized cost of energy (LCOE) than systems using oil-based HTFs. Water steam is utilized as both HTF and working fluid at the world’s most recent and biggest CSP plant, the Ivanpah solar power plant, which started operating in 2014. There are already seven operational CSP plants worldwide that use water/steam as a single fluid. Four of the factories are in Spain, with the other three in the United States [52]. The main concern with the water/steam HTF is a lack of water in arid locations. These CSP plants are generally located in deserts with enormous land areas and high direct solar radiation intensity [57].
The thermal stability of molten salts at high temperatures (usually > 500 °C) makes them good HTFs. Molten salts also exhibit high-temperature characteristics similar to water, such as similar viscosity and low vapor pressure [58]. Molten-salt-based HTFs are widely employed in current CSP systems, with the first molten-salt power tower systems being installed in 1984. HTFs in CSP applications have been studied and utilized as mineral, silicone, and synthetic oils. Because these oils are only thermally stable up to 400 °C, they are not often employed in high-temperature and highly efficient solar thermal systems [59]. Another concern with these thermal oils is their high price. Some heat transfer fluids, including some that have been employed in the past, are included in Table 2. This table shows different types of HTF used in CSP. Also, the operating temperature range, density, and viscosity are displayed at a temperature of 300 °C. However, Fig. 12, Fig. 13, Fig. 14, Fig. 15 presents the variation of thermophysical properties of these different HTFs with the temperature. Generally, it is noticed that increasing the temperature of all the used HTF decreases the density, thermal conductivity, and viscosity. While increasing the temperature increases the HTF-specific heat capacity. According to the figures, Therminol 72 has the maximum density in the temperature range of 0 – 275 °C. Dowtherm G, on the other hand, has the maximum density above 275 °C. Therminol 12-D has the highest specific heat capacity in the temperature range 0 – 250 °C, Therminol XP has the highest in temperature range 250 – 330 °C, and Therminol VP-3 has the highest in temperature range 330 – 360 °C. Among the HTFs, Therminol 72 has the maximum thermal conductivity. Therminol 66 has the highest viscosity, whereas Therminol LT has the lowest.
Table 2. Some of heat transfer fluids (HTF) used in CSP.
| Heat transfer fluid | Empty Cell | Composition (%) | Operating temperature Range ( °C) | Viscosity at 300 °C (mPa.s) | Density at 300 °C (kg/m3) | Heat capacity at 300 °C (kJ/kg.K) | Reference | |||
|---|---|---|---|---|---|---|---|---|---|---|
| Empty Cell | Ca(NO3)2 | NaNO2 | NaNO3 | KNO3 | ||||||
| Hitec | – | 7 | 40 | 53 | (142 – 535) | 3.16 | 1640 | 1.56 | [60] | |
| Hitec XL | 48 | 7 | – | 45 | (120 – 500) | 6.37 | 1992 | 1.44 | [60] | |
| Solar Salt | – | – | 60 | 40 | (220 – 600) | 3.26 | 1899 | 1.49 | [60] | |
| Therminol VP-1 | Diphenyl biphenyl oxide | (12 – 400) | 0.2 | 815 | 2.31 | [60,61] | ||||
| LiNO3 Mixture | – | (550 – 120) | – | – | – | [60] | ||||
| Therminol 62 | Isopropyl biphenyl mixture | (?22 – 345) | 0.239 | 730 | 2.53 | [62] | ||||
| Therminol 66 | Modified terphenyl | (?3 – 345) | 0.413 | 809 | 2.57 | [63] | ||||
| Therminol XP | White mineral oil | (?20 – 315) | 0.375 | 690 | 2.95 | [64] | ||||
| Therminol VP-3 | Phenylcyclohexane + bicyclohexyl | (2 – 330) | 0.199 | 687 | 2.747 | [65] | ||||
| Therminol LT | Alkyl-substituted aromatic | (?75 – 315) | 0.114 | 583 | 2.88 | [66] | ||||
| Therminol D-12 | Synthetic hydrocarbons | (?94 – 230) | 0.135* | 562* | 3.08* | [67] | ||||
| Therminol ADX-10 | Synthetic aromatic hydrocarbon mixture | (?56 – 250) | 0.275* | 686* | 2.72* | [68] | ||||
| Therminol 54 | Synthetic hydrocarbon mixture | (?28 – 280) | 0.33 | 672 | 2.9 | [69] | ||||
| Therminol 55 | Synthetic hydrocarbon mixture | (?28 – 300) | 0.334 | 672 | 2.9 | [70] | ||||
| Therminol SP | Synthetic hydrocarbon mixture | (?28 – 300) | 0.334 | 672 | 2.9 | [71] | ||||
| Therminol 59 | Alkyl-substituted aromatic | (?49 – 315) | 0.251 | 755 | 2.62 | [72] | ||||
| Therminol 68 | Mixture of synthetic aromatics | (?26 – 360) | 0.35 | 826 | 2.527 | [73] | ||||
| Therminol 72 | Mixture of synthetic aromatics | (?14 – 380) | 0.23 | 825 | 2.311 | [74] | ||||
| Therminol 75 | Terphenyl/quaterpheny | (80 – 385) | 0.368 | 872 | 2.28 | [75] | ||||
| DOWTHER A | Diphenyl Oxide/Biphenyl Blend | (15 – 400) | 0.2 | 801.3 | 2.373 | [76] | ||||
| DOWTHER Q | Mixture of diphenylethane and alkylated aromatics | (?35 – 330) | – | – | – | [77] | ||||
| DOWTHER G | Mixture of di- and tri-aryl compounds | (?6 – 360) | 0.3 | 833.8 | 2.507 | [78] | ||||
| DOWTHER RP | Diaryl alky | (0 – 350) | 0.38 | 817.4 | 2.483 | [79] |
*Values were Taken at 250 °C.


2.3. Energy storage systems (ESS)
Several methods can be used to store energy. Often, these technologies are grouped based on how long the energy will be retained. The two most popular ways to categorize energy storage systems are by the type of energy storage and the discharge duration. Based on the discharge time, energy storage techniques are classified as short-term (seconds or minutes), medium-term (minutes or hours), and long-term (hours to days). The type of transformed energy heavily influences the categorization of energy storage methods. As indicated in Fig. 16, Mechanical, electrochemical, thermal, electrical and chemical energy storage are the five basic categories that they may be divided into [80]. When needed, these technologies convert energy into a different form for storage before returning it to its original form [81].

The operating principle of CAES is quite straightforward. The storage is charged by converting electrical energy through electrically driven compressors into the potential energy of pressed air. The compressed air is released when needed to continue generating power by allowing air to expand through an air turbine. It now ranks second in bulk energy storage behind PHS. To provide continuous load reaction and peak generation, CAES is used as a source of flexible supply at utility sizes between 10 MW and 100 MW. For almost 40 years, CAES, with an estimated efficiency of 70% performed successfully [82,83]. The PHS uses an electric pump that runs on electricity during off-peak hours to transfer water from a lower tank to a higher tank, dam, or reservoir, storing this water at a high level in form of potential energy. The turnaround converts the potential energy into mechanical energy, which is then converted to electrical energy, when there is high demand. PHS has a 70–80% roundtrip efficiency. The expected lifespan of PHES is between 40 and 60 years. It is the most popular and reasonably priced choice for large-scale energy storage [81,84]. A flywheel functions as a mechanical battery by storing kinetic energy in the manner of rotational mass. Rotor is often fitted in an evacuated cylinder, allowing it to use renewable or off-peak electricity to accelerate at very high speeds and store it as rotational energy. When storing energy, the device acts as a motor and a generator when discharging. Flywheels have a high energy efficiency of higher than 85%. Flywheels are ideal for switching between medium and high powers (kW-MW) within very short periods of time (seconds) [81].
Gravity Storage is a technique that permits huge amounts of power to be stored for 6–14 h and then released. The fundamental concept relies on the hydraulic lifting of a large rock mass. Electrical pumps, used nowadays in hydro-power plants, are used to flow water beneath a moving rock piston, to lift up the rock mass. When the supply of renewable energy is insufficient, the water, which is under extreme pressure from the rock mass, is directed to a turbine, as in standard hydroelectric facilities, and employs a generator to create power. The range of energy storage options is 1 to 10 GWh, which is comparable to large Hydro-power dams. [85]. Battery energy storage system (BESS) is a cutting-edge technology solution that allows energy to be stored in a variety of ways until it is needed. Rechargeable batteries are utilized in lithium ion battery storage systems in particular to store energy produced by solar panels or provided by the grid and then make it available when needed. The benefits of battery energy storage include increased renewable energy production, cost savings, and sustainability due to reduced consumption. The typical lifespan of energy battery storage devices is 5 – 15 years [86].
The same basic equations that govern capacitors are used in supercapacitors, which are energy storage devices. However, in order to accumulate large amounts of charge carriers and capacitances, supercapacitors commonly use porous carbon or electrodes with larger surface areas and thinner dielectrics. This type of system offers a number of advantages, including exceptionally high capacitance characteristics, on the scale of thousands of farads, extended cycle life, low internal resistance, rapid charging and discharging, remarkable reversibility, great low-temperature performance, no destructive material, cheaper cost per cycle, and high cycle efficiency (up to 95%). [87]. The electrodynamic concept underpins the Superconducting Magnetic Energy Storage (SMES) technology. When direct current flows through a superconducting coil that has been cryogenically cooled to an extremely low temperature, an energy-storing magnetic field is formed. In most cases, niobium-titanium is used to make the conductor, while fluid helium at 4.2 K or super liquid helium at 1.8 K is used as the coolant [81]. The immediate availability of the required electricity is one of the key advantages of SMES. The framework’s high overall round-trip efficiency (between 85% and 90%) and the potent yield that may be produced in a short amount of time are further characteristics [88].
An electrolyzer, a hydrogen storage tank, and a fuel cell are typical components of a hydrogen storage system. An electrolyzer is a device that employs electricity to electrochemically transform water into hydrogen and oxygen. In order to create electricity, both gasses must enter a fuel cell. There, they go through an electrochemical process that is the opposite of water splitting: hydrogen and oxygen react to create water, while heat is generated to produce electricity [89,90]. Hydrogen is produced by electrolyzing water using off-peak electricity for use in energy storage. hydrogen may also be stored in different viable options such as, liquefied gas, metal hydrides, compressed gas or carbon nanostructures [81]. There are three types of TES systems, only one of which is commercially available in the electricity sector. Sensible heat storage is significantly simpler and more affordable than the alternatives. Thermal-chemical storage systems and latent energy storage are expensive and still primarily experimental technologies. The most often used TES in the energy production sector is sensible heat storage. In a sensible heat TES system, energy is stored by heating or cooling a solid or liquid storage medium, such as molten salt, sand, water or rocks. Sensible heat storage is widely employed in CSP plants, where the use of TES enables a project to produce energy far after the sun sets. In most CSP plants utilizing TES, molten salts, which can withstand extremely high temperatures, are the chosen medium. Despite being used less often in the energy production sector, latent heat storage has shown promise in a number of recent technologies. A change in the storage medium’s condition, such as from solid to liquid, is necessary for latent heat storage. Phase change materials (PCMs) are a common name for latent heat storage media. Thermo-chemical storage (TCS), as the name implies, employs chemical processes to store energy. Compared to PCMs, TCS systems have an even higher energy density [48,91].
Each energy storage system has distinctive features and characteristics that, in certain cases, make them stand out from one another. It is feasible to choose the best appropriate energy storage technology for a specific situation using these traits and attributes. On the basis of the following technological features, Table 3 compares the main categories of energy storage systems.
Table 3. Technical parameter comparison between the different energy storage systems [92].
| Technology | Power rating (MW) | LCOE ($/kWh) | Lifetime (Years) | Cycle efficiency (%) |
|---|---|---|---|---|
| PHS | 30 – 5000 | 5 – 100 | 40 – 60 | 70 – 87 |
| CAES | 110 – 1000 | 2 – 120 | 20 – 40 | 42 – 54 |
| TES | 0.1 – 300 | 3 – 60 | 20 – 30 | 30 – 60 |
| Li-ion | 0 – 100 | 600 – 3800 | 14 – 16 | 75 – 97 |
| Lead Acid | 0 – 40 | 50 – 400 | 5 – 15 | 63 – 90 |
| Fly Wheels | 0.25 – 20 | 1000 – 14,000 | 15 – 20 | 90 – 95 |
| Supercapacitors | 0 – 0.3 | 300 – 2000 | 10 – 30 | 84 – 97 |
| SMES | 0.1 – 10 | 500 – 72,000 | 20 – 30 | 95 – 98 |
| Fuel Cells | < 58.5 | 2 – 15 | ? 20 | 20 – 66 |
Although TES has one of the lowest cycle efficiencies when compared to other technologies, according to Table 3, it has the a low LCOE among the other technologies with a very long lifetime. The effects of adding TES on the LCOE of various renewable energy systems and hybrid renewable energy systems will be compared with other solutions in the following sections.
2.4. Thermal energy storage (TES) systems for CSP
Currently, two TES commercialized technologies are used in CSP projects around the world; molten salts storage tanks and steam accumulators. Steam accumulation tanks are typically cylindrical with elliptical ends made of boiler plates. One of the primary benefits is that the storage fluid is water, which eliminates price uncertainty in the storage medium. Because of their short reaction times and high discharge rates, steam accumulators are a proven choice for compensating transients and mid-term storage to match supply/demand curves when there is no radiation. Steam accumulation is one of the most successful methods of TES. However, the steam accumulator idea is restricted by a poor connection between volume and stored energy; also, its discharge process exhibits a drop in pressure, failing to achieve nominal conditions in the turbine. There are just two commercial tower plants in existence that use steam accumulator TES; PS10 (with four steam accumulator tanks) and PS20, both situated in Spain [93].
There are two types of molten salt storage tanks, direct and indirect; in the direct TES the salt serves as both the HTF and storage medium in the system. The Solar Two Project at Sandia National Laboratories, which was completed in 1996 with a tower power plant, presented the first major two-tank molten salt storage system. A heat exchanger decouples the thermal storage from the solar receiver’s HTF loop in an indirect storage system. Since 2009, the solar thermal power plant Andasol 1 has run the earliest commercial system with indirect TES. However, compared to tanks used in two-tank thermal storage systems, the thermocline storage system only uses one tank. The storage tank depends on the buoyancy phenomenon to maintain thermal stratification since the number of tanks has been reduced to one, containing both hot and cold fluid. The filler material also functions as a porous medium flow distributor, reducing unwanted secondary velocities that may otherwise de-stratify the hot and cold HTF zones of the tank [94].
On the same side, PCM storage is completely passive, which means that the storage medium remains stationary throughout charge and discharge. Heat transmission into the PCM is facilitated by the HTF being pushed through a tube registry inserted in the PCM. Currently, it is expected that these tube registries consist of tiny, vertically oriented heat exchangers arranged in groups that are connected in series and parallel. In order to obtain the desired flow rates, output temperatures, and overall performance, several heat exchangers are organized in parallel and series. The series number is based on the needed effective tube length, and the parallel number is based on the required effective tube number. Multiple PCMs must be arranged in sequence of melting temperature to step the HTF temperature to the correct level in order to satisfy the requisite output temperatures. Each PCM with a distinct melting temperature is assigned to its own bucket. These buckets are then arranged in succession and referred to as a cascade [95].
TES systems can increase the efficiency with which solar thermal energy is converted into electricity. They provide effective heat storage throughout the day so that power generation can continue at night. It has been found that integrating a TES system with a CSP plant increases the power plant’s capacity factor by more than 20% and decreases the LCOE by around 6% by increasing electricity production [96]. H. Mahon et al. [27] conducted the most recent review on thermal energy storage systems. The researchers’ goal was to identify some of the development challenges currently faced by the four seasonal thermal energy storage options—tank, pit, borehole, and aquifer—and then some of the work being done to overcome these challenges to enable wider adoption throughout energy systems.
The solar multiple is the ratio of the thermal power generated by the solar field at the design point to the thermal power required by the power block under nominal conditions. Recent studies investigated the optimum size of both TES and the solar multiple for different CSP plants, and it is the effect on the LCOE. Kuravi et al. [97] investigated the impact of various TES sizes on the LCOE of a CSP plant located in Daggett, California, using System Advisor Model (SAM). It has been found that the LCOE is reduced by 20% when TES size of 16-h is used as shown in Fig. 17 compared with other sizes [97].

Similarly, Qoaider et al. [98] al studied the effect of TES size and solar multiple for Andasol 1 CSP plant located in Spain. Fig. 18 illustrates that employing TES in the investigated location with solar multiple greater than 1.5 and the same meteorological conditions is more economically advantageous. On the same side, Praveen et al. [99] proposed a design for a 100 MW parabolic trough-based CSP plant and used SAM for modeling and optimization at two separate sites in Abu Dhabi, United Arab Emirates, and Aswan, Egypt. It has been found that the utilization of thermal energy storage with a suitable size provides higher energy production and lower LCOE as shown in Fig. 19 for both locations. However, because the HTF (used in both the solar field and the TES) requires part of the stored heat to keep the HTF from freezing, oversizing would raise the LCOE and decrease the yearly production.


Based on the data shown in Fig. 17 through 19, it is possible to draw the conclusion that the solar multiple has a considerable impact on the size of the TES, which in turn has an impact on both the LCOE and the energy production of the system. Changing the size of the TES will result in an unstable power plant condition. For instance, increasing the size of TES will require increasing the solar multiple in order to make full use of the TES and vice versa. If the ideal size of the TES is selected as shown in Fig. 19, then adjusting the solar multiple up or down from a certain value will result in an increase in the LCOE and a decrease in the yearly energy production. Therefore, it is important to carry sensitivity analysis when designing both the solar field and TES sizes.
2.5. Water management in CSP
Water availability is a challenge for constructing any thermoelectric power plant, not just CSP, in arid and semi-arid locations with high water demand. CSP facilities require a large amount of water to create energy. This water is used for mirror cleaning, steam creation, and cooling when wet cooling is employed [100]. As a result, the most significant aspect of the requirements that must be improved is wet cooling. Wet cooling takes significantly more water than dry cooling; the Noor 1 plant in Morocco uses around 74% of total water consumption for the wet cooling process as provided by experimental data from the power plant [101]. A. Liqreina et al. [34] compared the Andasol 1 power plant in Spain that uses wet cooling system to the identical but dry-cooled power plant in Jordan, the following results were obtained: the total efficiency of the dry cooled plant in Ma’an is lowered by 3.1%, and the water usage is reduced by 92%. Energy yield improved by 21.8%, while LCOE decreased by 18.8%. The findings of this study show that dry-cooled CSP power plants in locations with considerably high DNI values are an appealing economic and technical alternative to explore in future project development. Ogunmodimu et al. [102] investigated CSP technologies from environmental, social, and operational perspectives. They determined that parabolic trough collectors are one of the most desirable solutions because of their maturity, despite their high water consumption compared to other systems. The authors found that while the parabolic dish concentrator has the lowest LCOE and water consumption, it lacks a wide range of proven applications. Fig. 20 shows a comparison between the different cooling techniques.

3. Hybrid renewable energy with CSP
In hybrid systems, both wind turbines and photovoltaics store their energy in the CSP plant’s TES through an electric heater, as shown in Fig. 21, or in a separate energy storage system such as batteries to prevent electricity curtailment practices [103] and dispatch electricity as needed. When there is a deficit in one kind of available renewable energy resources, other technologies, such as geothermal power plants, may operate in parallel with CSP plants to improve performance. The power generation from the PV and wind systems is recovered by an electric heating mechanism to warm the solar salt in the TES as soon as they start operating. The thermal energy from the CSP system and the electric heating device generated by the power rejection of the PV and wind systems are both stored in the TES. The TES’s capacity might be enhanced in the meantime to store additional thermal energy during severe weather. To satisfy load demand and address the mismatch, the CSP system can dispatchable electricity in a flexible manner. Currently, there are two hybrid PV-CSP projects under construction in China and United Arab Emirates. Table 4 shows some of the specifications of these power plants.

Table 4. Hybrid PV-CSP plants under construction. (Source: NREL).
| Parameter | CEIC Dunhuang | Noor energy 1 |
|---|---|---|
| Country | China | United Arab Emirates |
| Capacity | 100 MW (Linear Fresnel) and 600 MW PV | 700 MW (Parabolic Trough & Power Tower) and 250 MW PV |
| Total Construction Cost ($) | 4300 million | 14,780 million |
| Status | Under Construction | Under Construction |
| Start Year | 2023 | 2022 |
3.1. Hybrid CSP/Wind, CSP/PV with TES
The 800 MW Midelt CSP project in Morocco is the first hybrid PV-CSP plant to employ an electric heater to store power generated by PV. The electricity generated by PV will be used to heat the molten salt and then stored in the TES. Originally, the project was supposed to incorporate PV with batteries as a backup to meet daytime needs, as well as a CSP plant with thermal storage to meet nighttime demand. Nonetheless, it has been shown that utilizing thermal energy storage for both units can lower the project’s LCOE to 0.07$/kWh. If the energy demand is high in comparison to the available energy storage and primary resources, Ayadi et al. [104] evaluated the hybrid CSP technology as a solar energy configuration that satisfies predictability and dispatchability requirements. This study’s primary goal is to offer a realistic CSP-Wind scenario for the local market and weather in Jordan at the time it is conducted. The results show that hybridization enhances capacity factor of hybrid power plant up to 94% and offers exceptionally cheap LCOE of 0.063 $/kWh lower than standalone CSP plant. After 25 years of operation, the total earnings of the CSP plant with 5 h of energy storage are approximately 4.5 times more than those of the wind plant of the same scale. Similarly, A. Zurita et al. [105] studied different configurations of hybrid CSP/PV and TES system with and without BESS using fixed plane and tracking system for the PV system. It has been found that the lowest achieved LCOE of the hybrid system was found to be 0.0772 $/kWh and 0.0750 kWh for fixed and tracking system respectively without using BESS. However, the integration of the BESS to the hybrid system raised the capacity factor of the system by 7 to 8% approximately, but that resulted in increasing the LCOE as well by 0.012 $/kWh for the hybrid system.
J.A. Aguilar-Jiménez et al. [106] performed a Techno-Economic analysis on a hybrid PV-CSP system for usage as an energy source in isolated microgrids. According to the findings, the LCOE for the PV-CSP hybrid system is just 2% higher than the LCOE for the PV-Battery system. The LCOE would be 3.43% lower if the PV-CSP was employed with a 50% higher energy consumption. Furthermore, if the demand surpasses 500 kW, the PV-LCOE CSP’s would be 26% cheaper. C. A. Pan and F. Dinter [107] presented a hybrid plant that combines PV and central receiver CSP plants. Simulations of solo PV and CSP plants were performed and compared to simulation results of the proposed CSP-PV hybrid plant. According to the findings, increased yearly energy output and capacity factors of up to 90% are possible. Additionally, system size and expenses can be decreased. Allan Starke et al. [108] investigated the feasibility of combining a CSP plant with a PV system by creating two models for hybrid CSP-PV systems for an Atacama Desert location using the Transient System Simulation tool (TRNSYS). It has been discovered that enabling thermal energy to be stored while the PV plant is in operation improves the capacity factor of the power plant, assisting in the achievement of a completely dispatchable solar electricity production system. M. Petrollese and D. Cocco [109] investigated the feasibility of attaining full dispatchability and the best design parameters for a hybrid CSP-PV plant. The findings revealed that hybrid CSP-PV plants become very cost efficient when a constant power production is required for daily time spans greater than roughly 16 h.
3.2. Hybrid CSP/PV/Wind with TES
Chennaif et al. [110] developed a new technique called The Electric System Cascade Extended Analysis (ESCEA) for evaluating the appropriate size of a standalone hybrid power production system that incorporates PV, wind, and CSP combined with simultaneous TES and BESS. The capacity of the various production and storage components of the system, as well as the percentage contribution of each energy source, are determined by the ESCEA algorithm, which offers all feasible alternatives. The algorithm then chooses the optimal option, which has the lowest LCOE. The algorithm was applied in case study in Oujda, Morocco with an electric load of 50 MW. Several configurations were studied including CSP/PV/Wind with both Batteries and TES but with different share percent for each power plant. The algorithm indicated that lowest achievable LCOE was 0.18 $/kWh for hybrid CSP/PV/Wind system with sharing percent of 65.4%, 26.1% and 8.5% respectively, with TES and BESS compared to other 8 different configurations. Meanwhile, the configuration of PV with BESS and Wind with BESS achieved 0.24 $/kWh and 0.40 $/kWh with an increase of 33.3% and 122.2% with 0% Loss of Power Supply Probability (LPSP). Al-Ghussain et al. [111] investigated the techno-economic feasibility of coupling TES with several PV, wind, and CSP configurations in Jordan, and they compared it to scenarios using lithium-ion batteries. The intermittent nature of solar and wind resources was found to be compensated using TES. In comparison to the other scenarios, the addition of TES to the CSP/PV/Wind system produced the lowest LCOE of 0.0485 $/kWh and the highest renewable energy system fraction percentage of 99.35%.
3.3. Hybrid PV/Wind with TES
Similarly, Guo et al. [113] developed a design for a hybrid wind/PV system employing TES to utilize a 100 MW transmission grid in Karachi as shown in Fig. 22, Pakistan using the MOPSO algorithm. They then compared the LCOE findings with those obtained when using BESS in place of TES and without the usage of storage devices. When TES is added to the hybrid system, the findings reveal a minor decrease in LCOE of 0.074% but a considerable increase in power output of 11.37%. Meanwhile, the LCOE significantly increased by 12.79% because of BESS replacing TES. From an economical perspective, He et al. [114] examined four different energy storage technologies (BESS, TES, PHS, and Hydrogen Storage) to be deployed in a hybrid PV/Wind system for a 100 MW demand profile in Karachi, Pakistan. The findings demonstrate that, under the same LPSP (10%), the LCOEs of TES, BES, Hydrogen, and PHS are, in that order, 0.1421 $/kWh, 0.01793 $/kWh, 0.1956 $/kWh, and 0.2196 $/kWh. This proves that TES is also the most economical energy storage solution for variable load profiles. In addition, Y. He et al. [115] suggested a wind/PV hybrid system with TES and investigated the multiple objective capacity optimization issue that incorporates decreasing LCOE. Different optimization techniques were applied, including algorithms (NSGA-III and MOEA/D) and TOPSIS for decision-making. The hybrid system’s lowest attainable LCOE was determined to be 0.1106 $/kWh with an LPSP of 15.3%.

3.4. Hybrid geothermal/CSP with TES
In their commercial applications, geothermal and concentrating solar power (CSP) technologies commonly employ heat at various temperatures. This makes it possible for geothermal bottoming cycles and solar topping cycles to be hybridized in places where both resources are present as seen in Fig. 23. McTigue et al. [116] presented technical and financial possibilities of solar-powered steam topping cycle added to an underperforming geothermal power plant located in Idaho, United States. The geothermal cycle is brought back to its design position by the waste heat from the topping cycle. This hybrid idea boosts the efficiency and power production of the geothermal plant while making efficient use of the high temperatures that may be produced by concentrating solar fields. The researchers studied the effect of adding TES on the LCOE to the hybrid system or replacing it with equivalent PV with BESS. The results demonstrated a slight increase in the LCOE of 2.4% but with a significant increase in the annual energy production by 20.44%. Meanwhile, the PV with BESS system provided higher LCOE by 46.09% than utilizing the suggested hybrid system with TES. Similarly, McTigue et al. [117] studied hybrid Geothermal/CSP plant for solar heat addition to compensate for the declining in geothermal resources for geothermal plant in California, United States. The results of the hybrid with 3 h and 10 h TES size system were compared to an equivalent PV with BESS. It has been found that it was discovered that the hybrid system with 3 h of storage had a 28% reduced LCOE, while a system with 10 h of storage had a 47% lower LCOE.

Table 5 shows a list of recent studies that focus on hybrid systems using TES and their LCOE results are included along with the study’s location. The table shows that in Jordan, where both GHI and DNI values are relatively high, it is possible to achieve 0.0485 $/kWh LCOE of hybrid PV/Wind/CSP with TES system, leading to excellent performance for PV and CSP plants and a significant decrease in LCOE [111]. In general, regions with high DNI values, such as the MENA region, Chile, the United States, Australia, and China, may obtain LCOEs of less than 0.1 $/kWh. TES has the lowest LCOE and one of the highest lifespan systems when compared to other energy storage technologies. Additionally, it enables hybrid systems to increase their capacity factor to 90%, which helps to overcome the variability of renewable resources and the intermittency of renewable energy systems generation, resulting in more stable grids and better demand matching.
Table 5. Summary of LCOE results from recent hybrid renewable energy systems research.
| Reference | System configuration | Location | LCOE ($/kWh) |
|---|---|---|---|
| [118] | PV/CSP with TES | Delingha, China | 0.1484 |
| PV/Wind/CSP with BESS and TES | 0.1964 | ||
| [119] | PV/Wind/CSP with BESS and TES | Huade, China | 0.0997 |
| Ulan Moron, China | 0.1111 | ||
| [120] | PV/Wind/CSP/Diesel Generator with BESS and TES | Tabuk, Saudi Arabia | 0.0917 |
| PV/Wind/CSP with BESS and TES | 0.1557 | ||
| [117] | Geothermal/CSP with TES | California, United States | 0.081 |
| PV with BESS | 0.148 | ||
| [112] | PV/Wind/CSP with TES and PHS | China | 0.1186 |
| [105] | PV/CSP with TES | Northern Chile | 0.07722 |
| [110] | PV/Wind/CSP with TES and BESS | Oujda, Morocco | 0.1830 |
| CSP with TES | 0.1963 | ||
| PV with BESS | 0.2383 | ||
| Wind with BESS | 0.40 | ||
| [111] | PV with TES | Jordan | 0.0493 |
| PV/Wind with TES | 0.0497 | ||
| PV/CSP with BESS | 0.0488 | ||
| PV/CSP with TES | 0.0499 | ||
| PV/Wind/CSP with TES | 0.0485 | ||
| PV/Wind/CSP with BESS | 0.0497 | ||
| [116] | Geothermal/CSP | – | 0.125 |
| Geothermal/CSP with TES | 0.128 | ||
| PV with BESS | 0.187 | ||
| [121] | PV/Wind with BESS | Australia | 0.122 – 0.414 |
| PV/Wind with TES | 0.059 – 0.113 | ||
| [115] | PV/Wind with TES | Karachi, Pakistan | 0.1106 |
| [122] | PV/Wind/CSP with TES | Zhangjiakou, China | 0.2775 |
| [114] | PV/Wind with TES | Karachi, Pakistan | 0.1224 |
| PV/Wind with BESS | 0.1812 | ||
| PV/Wind with PHS | 0.2225 | ||
| PV/Wind with Hydrogen tank | 0.1863 | ||
| [113] | PV/Wind | Karachi, Pakistan | 0.1078 |
| PV/Wind with TES | 0.1077 | ||
| PV/Wind with BESS | 0.1215 | ||
| [104] | Wind/CSP with TES | Jordan | 0.063 |
4. Current status and future outlook
CSP plants are divided into three generations based on their thermodynamic cycle and cycle efficiency Fig. 24. The first generation of CSP plants use the Rankine cycle, which has a design cycle efficiency of 28–38% and a peak cycle temperature of 240–440 °C, and the PTC, Solar Tower, and LFR are often employed [123]. Because most first generation CSP facilities lacked thermal storage, they could only operate under sunny weather throughout the day. First generation CSPs continue to account for the vast bulk of deployed CSP capacity, with PTC systems contributing currently for 64% of total projects. Most second generation CSP plants are made up of PTC, SPT, and LFR, with Rankine cycle efficiencies ranging from 38 to 45% and maximal cycle temperatures reaching 565 °C. Almost all new second generation CSP plants are outfitted with thermal energy storage systems. These second generation CSP facilities may attain an annual solar-electric efficiency of roughly 10–20% because of their high cycle efficiency, compared to 9–16% for first-generation CSP systems [123]. The third generation of CSP plants focuses on increasing the maximum cycle temperature using more modern materials for heat transmission, thermal storage, and working fluid in the thermal cycle. All third-generation CSP technologies, however, are still in the demonstration stage, with no commercial applications available [124]. The primary goal of third-generation CSP is to minimize the LCOE by increasing solar electric efficiency when operational temperatures rise over 600 °C [124].

According to the European Solar Thermal Energy Association, the International Energy Agency, and Greenpeace, CSP might provide 3–3.6% of the global energy supply in 2030 and 8–11.8% by 2050. This suggests a necessity for a two-digit capacity increase in the next years, which has not yet been shown [125]. Other projections indicate that the cost of CSP might fall to $0.05/kWh by 2025 [126].
Developers of CSP plants using molten-salt TES systems are facing several challenges including the reduction of molten salt cost and reducing the risk of molten salt freezing. Parasitic use, antifreeze costs, and circulation pumping costs are all issues. Reducing the cost of the thermal storage asset used by the plant is one of the primary objectives of decreasing the LCOE of CSP. According to IRENA [127], CSP systems with four to eight hours of thermal storage capacity have total installed costs ranging from 3183 $/kW to 8645 $/kW. Projects with eight hours or more of thermal storage capacity have a narrower range, ranging from $4077 to $5874 per kW. According to a recent IRENA assessment [128], significant progress in lowering the prices of both sensible and latent heat thermal storage is projected over the next two decades, with costs as low as 12 $/kWh when incorporated into CSP, PV, or Wind projects. Table 6 lists some of the TES-related objectives for the coming years. The examination of common material qualities and main physical attributes will be used to develop new HTFs in the future. Corrosion, flammability, toxicity, thermal stability, cost, and availability are all common material properties [129].
Table 6. Primary TES with CSP technical innovation objectives [128].
| Parameter | Latent | Sensible | Thermochemical | ||||||
|---|---|---|---|---|---|---|---|---|---|
| 2018 | 2030 | 2050 | 2018 | 2030 | 2050 | 2018 | 2030 | 2050 | |
| LCOE ($/kWh) | 25–90 | 25–35 | < 12 | 25–30 | < 15 | < 12 | Under Research | Pilot Scale (80 to 160) | Demonstration < 80 |
| Efficiency (%) | > 90 | > 92 | > 95 | > 90 | > 92 | > 95 | 40–50 | – | |
| Lifetime (Cycles) | 3000 – 5000 | 4000 – 5000 | 5000 – 10,000 | < 10,000 | > 10,000 | < 100 | 500 – 1000 | > 1000 – 3000 | |
| Energy Density (kWh/m3) | 30–85 | 70–200 | – | 800 – 1200 | |||||
| Working Temperature ( °C) | < 600 | 600 – 750 | 700 – 850 | < 565 | 600 – 700 | > 700 | 700 – 850 | 500 – 900 | 500 – 1000 |
5. Technical and economic challenges
Several technological and economic problems must be overcome by concentrated solar power plants, thermofluids and heat transfer fluids, and thermal energy storage systems. Economic problems include high capital costs, pricing unpredictability, finance, lack of scale, material prices, availability, and operational expenses. Technological obstacles include the variability of solar resources, integration with the grid, corrosion, thermal stability, and system complexity. These problems underline the need for ongoing innovation and investment in CSP technology to make it more cost-effective and efficient, as well as to overcome hurdles to large-scale deployment that are both technological and economic. In addition, there is a need for governmental support and regulatory frameworks that encourage the development of CSP technology, which may assist in accelerating the transition to a future that is powered by clean energy.
The fluctuation of solar resources brought on by meteorological circumstances such as clouds and dust may have a negative impact on the effectiveness of CSP facilities. Thermal energy storage technologies that are utilized in CSP plants have the potential to be negatively impacted by thermal losses as well as the complexity of the system. Because of their inherent unpredictability, integrating them into the grid may be a difficult task, and regular maintenance is necessary to ensure that their effectiveness is maintained. CSP plants are expensive to build, they face uncertain electricity prices and financing challenges, and they lack economies of scale due to the early stages of the industry. All these factors contribute to the relatively high cost of CSP power in comparison to the cost of power generated by other renewable energy sources [125,[130], [131], [132], [133], [134]].
Thermofluids and heat transfer fluids used in Concentrated Solar Power (CSP) plants present several obstacles, both technically and economically. Damage may be caused by these fluids due to their corrosive nature and high temperatures, which can also shorten their lifetime and weaken their thermal stability over time. The management of material compatibility may be difficult at times, and fluid deterioration can result in decreased productivity. The price of fluids that have been specifically created for an application may be rather high, and certain fluids are not easily accessible, necessitating unique handling and shipping procedures. Recycling and disposing of these fluids may also be a costly and difficult task for the environment to do [[135], [136], [137]].
The efficiency of systems that store thermal energy may fluctuate, and thermal losses can cause a reduction in that efficiency, which can result in greater expenses to operate the system. Material compatibility is essential in the struggle against corrosion and other problems. Moreover, larger systems might be more complicated, which can result in increased expenses for both construction and maintenance. It may be tough and costly to scale up thermal energy storage systems because of the demand for specialized equipment and materials. The materials that are utilized in these systems can be rather costly. The need for heat tracing and insulation may lead to relatively high operational expenses, which is especially true for molten salt systems [138,132,139,140].
For the CSP industry to successfully overcome these technological and economic hurdles, there must be ongoing innovation and success in overcoming these technological and economic hurdles, there must be ongoing innovation as well as investment in the research and development of new technologies. Efficiency gains and cost savings may be achieved via the use of various operational, material, and design enhancements. Accelerating the deployment of CSP technology and overcoming hurdles to the market entrance may be made possible with the aid of policy support and regulatory frameworks that favor the development of CSP technology. In the end, the capacity of the CSP sector to become more cost-effective and competitive with other sources of renewable energy will determine how successful the industry will be.
6. Conclusions
The CSP technology is an efficient renewable energy technology for power generation which attracted the attention of researchers. CSP technology can generate electricity with high capacities in wide areas worldwide with total solar to electricity efficiency reached more than 16%. By comparing around 143 CSP projects worldwide with 114 in operation, 20 now non-operational or decommissioned, and 9 under construction to begin operations in 2022 and 2023. The comparison showed that the Spain, the United States, and China are the leading countries in the use of CSP plants. Spain has the most installed capacity with a total of 2.3 GW and 51 projects built around the country, all of which are operational. Among the four common CSP technologies, the most utilized technology is parabolic trough collectors (PTC), with 91 projects, followed by solar thermal towers with 34 projects, linear Fresnel reflectors with 16 projects, and just two dish projects, both of which are decommissioned. Around 75% of installed capacity utilized the PTC technology. Furthermore, the linear Fresnel reflectors technology was found to have the largest land usage factor among the other technologies. However, the needed solar field area per 1 MW of capacity was found to be roughly 11,000 m2 for both linear Fresnel and Power Tower. Further, Covid-19 Pandemic had a detrimental impact on the deployment of CSP plants, with just 9 projects completed during that period (2020 – 2022). The LCOE reached a minimum value of 0.049 – 0.22 $/kWh for the hybrid integration method of PV and wind with the CSP.
Based on the current analysis, the following recommendations are essential for the next study in the area of hybrid renewable energy systems and TES, according to the findings of this study.
- 1 The design of the TES system is dependent on a variety of elements like the solar multiple of the CSP plant and the capacity of the power block. Thus, an optimization study is required to establish the optimal size of TES systems so that the LCOE may be as low as feasible.
- 2 A water footprint analysis and the development of water-saving technologies are essential for optimizing the use of water resources in CSP plants. This is because water is essential for the local communities where CSP projects are being built, as well as for the construction of CSP projects in arid areas.
- 3 It seems that hybrid PV/Wind/CSP using TES is a practical alternative with a high capacity factor and a low LCOE, which makes it a competitive choice for nations like Jordan that have higher DNI and GHI values.
- 4 A high-capacity factor is also present in hybrid CSP/PV/Wind systems with BESS, but the high LCOE indicates it may not be practical at present. Despite this, it is possible that in the next years, BESS may emerge as a viable choice because of further research and falling prices. PHS and CAES are both costly and contribute to an increased LCOE.
- 5 More research needs to be done on energy storage systems and heat transfer fluids to bring down the costs of renewable energy systems and improve their performance.
- 6 It is necessary to do further research can be directed toward the implementation of the Direct steam generation (DSG) technology in CSP.
Declaration of Competing Interest
The authors declare that they have no known competing financial interests or personal relationships that could have appeared to influence the work reported in this paper.
Data availability
- No data was used for the research described in the article.
References
- [1] “Why our work matters – solar sister.” https://solarsister.org/what-we-do/why-our-work-matters/?gclid=Cj0KCQjwhY-aBhCUARIsALNIC04NkVthgT8CYZ_6elyMB5KAWir-5ZMZCetdCOhjU9l6US2UbKsRnZcaArI8EALw_wcB (accessed Oct. 10, 2022). Google Scholar
- [2] “Why is energy storage such an important part of the renewables mix | Greentech renewables.” https://www.greentechrenewables.com/article/why-energy-storage-such-important-part-renewables-mix (accessed Oct. 10, 2022). Google Scholar
- [3] “Executive summary – electricity market report – July 2022 – analysis – IEA.” https://www.iea.org/reports/electricity-market-report-july-2022/executive-summary (accessed Oct. 06, 2022). Google Scholar
- [4] U. Nations, “The true costs of conventional energy | United Nations”, Accessed: Oct. 06, 2022. [Online]. Available: https://www.un.org/en/chronicle/article/true-costs-conventional-energy. Google Scholar
- [5] E.T. Sayed, et al.Renewable energy and energy storage systems Energies 2023, 16 (3) (2023), p. 1415, 10.3390/EN16031415 Feb. View in ScopusGoogle Scholar
- [6] “Annual energy outlook 2022 – U.S. Energy Information Administration (EIA).” https://www.eia.gov/outlooks/aeo/(accessed Oct. 06, 2022). Google Scholar
- [7] I. Renewable Energy Agency, “Global energy transformation: a roadmap to 2050,” 2018, Accessed: Oct. 06, 2022. [Online]. Available: www.irena.org. Google Scholar
- [8] K. Obaideen, et al.On the contribution of solar energy to sustainable developments goals: case study on Mohammed bin Rashid Al Maktoum Solar Park Int. J. Thermofluids, 12 (2021), Article 100123, 10.1016/J.IJFT.2021.100123 Nov.
- View PDFView articleGoogle Scholar
- [9] M. Rashad, N. Khordehgah, A. ?abnie?ska-Góra, L. Ahmad, H. JouharaThe utilisation of useful ambient energy in residential dwellings to improve thermal comfort and reduce energy consumption Int. J. Thermofluids, 9 (2021), Article 100059, 10.1016/J.IJFT.2020.100059 Feb.
- View PDFView articleView in ScopusGoogle Scholar
- [10] A. Yano, M. CossuEnergy sustainable greenhouse crop cultivation using photovoltaic technologies Renew. Sustain. Energy Rev., 109 (2019), pp. 116-137, 10.1016/J.RSER.2019.04.026 Jul.
- View PDFView articleView in ScopusGoogle Scholar
- [11] M.A.Z. Abidin, M.N. M.ahyuddin, M.A.A.M. ZainuriSolar photovoltaic architecture and agronomic management in agrivoltaic system: a review Sustainability, 13 (14) (2021), p. 7846, 10.3390/SU13147846 Jul. View in ScopusGoogle Scholar
- [12] M.A. A.bdelkareem, M. el Haj Assad, E.T. S.ayed, B. SoudanRecent progress in the use of renewable energy sources to power water desalination plants Desalination, 435 (2018), pp. 97-113, 10.1016/J.DESAL.2017.11.018 Jun.
- View PDFView articleView in ScopusGoogle Scholar
- [13] “Wind energy pros and cons.” https://www.solarreviews.com/blog/wind-energy-pros-and-cons (accessed Oct. 10, 2022). Google Scholar
- [14] “Intermittent electricity – energy education.” https://energyeducation.ca/encyclopedia/Intermittent_electricity (accessed Oct. 10, 2022). Google Scholar
- [15] H. Nazaripouya, C.C. C.hu, H.R. P.ota, R. GadhBattery energy storage system control for intermittency smoothing using an optimized two-stage filter IEEE Trans. Sustain. Energy, 9 (2) (2018), pp. 664-675, 10.1109/TSTE.2017.2754478 Apr. View in ScopusGoogle Scholar
- [16] A.G. O.labiRenewable energy and energy storage systems Energy, 136 (2017), pp. 1-6, 10.1016/J.ENERGY.2017.07.054 Oct.
- View PDFView articleView in ScopusGoogle Scholar
- [17] I. Renewable Energy Agency, “Renewable power generation costs in 2019,” 2020, Accessed: Oct. 05, 2022. [Online]. Available: www.irena.org. Google Scholar
- [18] B.R. D.avid, S. Spencer, J. Miller, S. Almahmoud, H. JouharaComparative environmental life cycle assessment of conventional energy storage system and innovative thermal energy storage system Int. J. Thermofluids, 12 (2021), Article 100116, 10.1016/J.IJFT.2021.100116 Nov.
- View PDFView articleView in ScopusGoogle Scholar
- [19] B.A.A. Yousef, A.A. H.achicha, I. Rodriguez, M.A. A.bdelkareem, A. InyaatPerspective on integration of concentrated solar power plants Int. J. Low-Carbon Technol., 16 (3) (2021), pp. 1098-1125, 10.1093/IJLCT/CTAB034 Sep. View in ScopusGoogle Scholar
- [20] D. Brough, H. JouharaThe aluminium industry: a review on state-of-the-art technologies, environmental impacts and possibilities for waste heat recovery Int. J. Thermofluids, 1–2 (2020), Article 100007, 10.1016/J.IJFT.2019.100007 Feb.
- View PDFView articleGoogle Scholar
- [21] H. Jouhara, et al.Thermoelectric generator (TEG) technologies and applications Int. J. Thermofluids, 9 (2021), Article 100063, 10.1016/J.IJFT.2021.100063 Feb.
- View PDFView articleView in ScopusGoogle Scholar
- [22] J.J. F.ierro, A. Escudero-Atehortua, C. Nieto-Londoño, M. Giraldo, H. Jouhara, L.C. W.robelEvaluation of waste heat recovery technologies for the cement industry Int. J. Thermofluids (7–8) (2020), Article 100040, 10.1016/J.IJFT.2020.100040 Nov.
- View PDFView articleView in ScopusGoogle Scholar
- [23] A. Baroutaji, et al.Advancements and prospects of thermal management and waste heat recovery of PEMFC Int. J. Thermofluids, 9 (2021), Article 100064, 10.1016/J.IJFT.2021.100064 Feb.
- View PDFView articleView in ScopusGoogle Scholar
- [24] A.G. O.labi, Q. Abbas, A. al Makky, M.A. A.bdelkareemSupercapacitors as next generation energy storage devices: properties and applications Energy, 248 (2022), Article 123617, 10.1016/J.ENERGY.2022.123617 Jun.
- View PDFView articleView in ScopusGoogle Scholar
- [25] Y. Wang, D.F. R.uiz Diaz, K.S. C.hen, Z. Wang, X.C. A.droherMaterials, technological status, and fundamentals of PEM fuel cells – a review Mater. Today, 32 (2020), pp. 178-203, 10.1016/J.MATTOD.2019.06.005 Jan.
- View PDFView articleGoogle Scholar
- [26] T. Salameh, et al.Best battery storage technologies of solar photovoltaic systems for desalination plant using the results of multi optimization algorithms and sustainable development goals J. Energy Storage, 55 (2022), Article 105312, 10.1016/J.EST.2022.105312 Nov.
- View PDFView articleView in ScopusGoogle Scholar
- [27] H. Mahon, D. O’Connor, D. Friedrich, B. HughesA review of thermal energy storage technologies for seasonal loops Energy, 239 (2022), Article 122207, 10.1016/J.ENERGY.2021.122207 Jan.
- View PDFView articleView in ScopusGoogle Scholar
- [28] A.G. O.labi, T. Wilberforce, M. Ramadan, M.A. A.bdelkareem, A.H. A.lamiCompressed air energy storage systems: components and operating parameters – a review J. Energy Storage, 34 (2021), Article 102000, 10.1016/J.EST.2020.102000 Feb.
- View PDFView articleView in ScopusGoogle Scholar
- [29] T. Salameh, M.A. A.bdelkareem, A.G. O.labi, E.T. S.ayed, M. Al-Chaderchi, H. RezkIntegrated standalone hybrid solar PV, fuel cell and diesel generator power system for battery or supercapacitor storage systems in Khorfakkan, United Arab Emirates Int. J. Hydrogen Energy, 46 (8) (2021), pp. 6014-6027, 10.1016/J.IJHYDENE.2020.08.153 Jan.
- View PDFView articleView in ScopusGoogle Scholar
- [30] S.A. A.lnaqbi, S. Alasad, H. Aljaghoub, A.H. A.lami, M.A. A.bdelkareem, A.G. O.labiApplicability of Hydropower Generation and Pumped Hydro Energy Storage in the Middle East and North Africa Energies, 15 (7) (2022), p. 2412, 10.3390/EN15072412 Mar. View in ScopusGoogle Scholar
- [31] Z. Zhou, et al.Estimation of the losses in potential concentrated solar thermal power electricity production due to air pollution in China Sci. Total Environ., 784 (2021), Article 147214, 10.1016/J.SCITOTENV.2021.147214 Aug.
- View PDFView articleView in ScopusGoogle Scholar
- [32] S. Di Leo, F. Pietrapertosa, M. Salvia, C. CosmiContribution of the Basilicata region to decarbonisation of the energy system: results of a scenario analysis Renew. Sustain. Energy Rev., 138 (2021), Article 110544, 10.1016/J.RSER.2020.110544 Mar.
- View PDFView articleView in ScopusGoogle Scholar
- [33] S. Fawzy, A.I. O.sman, J. Doran, D.W. R.ooneyStrategies for mitigation of climate change: a review Environ. Chem. Lett., 18 (6) (2020), pp. 2069-2094, 10.1007/S10311-020-01059-W Jul. View in ScopusGoogle Scholar
- [34] A. Liqreina, L. QoaiderDry cooling of concentrating solar power (CSP) plants, an economic competitive option for the desert regions of the MENA region Solar Energy, 103 (2014), pp. 417-424, 10.1016/J.SOLENER.2014.02.039 May
- View PDFView articleView in ScopusGoogle Scholar
- [35] N. Ghaffour, J. Bundschuh, H. Mahmoudi, M.F.A. GoosenRenewable energy-driven desalination technologies: a comprehensive review on challenges and potential applications of integrated systems Desalination, 356 (2015), pp. 94-114, 10.1016/J.DESAL.2014.10.024 Jan.
- View PDFView articleView in ScopusGoogle Scholar
- [36] O.A. M.arzoukLand-Use competitiveness of photovoltaic and concentrated solar power technologies near the Tropic of Cancer Solar Energy, 243 (2022), pp. 103-119, 10.1016/J.SOLENER.2022.07.051 Sep.
- View PDFView articleView in ScopusGoogle Scholar
- [37] R.R. H.ernandez, et al.Environmental impacts of utility-scale solar energy Renew. Sustain. Energy Rev., 29 (2014), pp. 766-779, 10.1016/J.RSER.2013.08.041 Jan.
- View PDFView articleView in ScopusGoogle Scholar
- [38] K.A. M.oore-O’Leary, et al.Sustainability of utility-scale solar energy – critical ecological concepts Front. Ecol. Environ., 15 (7) (2017), pp. 385-394, 10.1002/FEE.1517 Sep. View in ScopusGoogle Scholar
- [39] A. Dhar, M.A. N.aeth, P.D. J.ennings, M. GamalEl-Din, “Perspectives on environmental impacts and a land reclamation strategy for solar and wind energy systems Sci. Total Environ., 718 (2020), Article 134602, 10.1016/J.SCITOTENV.2019.134602 May
- View PDFView articleView in ScopusGoogle Scholar
- [40] A. Rahman, O. Farrok, M.M. H.aqueEnvironmental impact of renewable energy source based electrical power plants: solar, wind, hydroelectric, biomass, geothermal, tidal, ocean, and osmotic Renew. Sustain. Energy Rev., 161 (2022), Article 112279, 10.1016/J.RSER.2022.112279 Jun.
- View PDFView articleView in ScopusGoogle Scholar
- [41] P. Manikandan and D.S.P. Umayal, “A review on the various environmental impacts of renewable energy technologies,” 2015, Accessed: Mar. 08, 2023. [Online]. Available: www.ijrcar.com. Google Scholar
- [42] M. Bošnjakovi?, V. Tadijanovi?Environment impact of a concentrated solar power plant Tech. J., 13 (2019), pp. 68-74, 10.31803/tg-20180911085644 View in ScopusGoogle Scholar
- [43] R. HillerbrandWhy affordable clean energy is not enough. A capability perspective on the sustainable development goals Sustainability, 10 (7) (2018), p. 2485, 10.3390/SU10072485 Jul View in ScopusGoogle Scholar
- [44] H.L. Z.hang, J. Baeyens, J. Degrève, G. CacèresConcentrated solar power plants: review and design methodology Renew. Sustain. Energy Rev., 22 (2013), pp. 466-481, 10.1016/J.RSER.2013.01.032 Jun.
- View PDFView articleGoogle Scholar
- [45] H. Rezk, et al.Multi-criteria decision making for different concentrated solar thermal power technologies Sustain. Energy Technol. Assess., 52 (2022), Article 102118, 10.1016/J.SETA.2022.102118 Aug.
- View PDFView articleView in ScopusGoogle Scholar
- [46] “Concentrated solar power – Wikipedia.” https://en.wikipedia.org/wiki/Concentrated_solar_power (accessed Oct. 11, 2022). Google Scholar
- [47] Y. Li, J. Yuan, Y. YangA study on solar multiple for an integrated solar combined cycle system with direct steam generation Energy Procedia, 61 (2014), pp. 29-32, 10.1016/J.EGYPRO.2014.11.898 Jan.
- View PDFView articleGoogle Scholar
- [48] A.H. A.lamiThermal storage Adv. Sci., Technol. Innov. (2020), pp. 27-34, 10.1007/978-3-030-33788-9_4/FIGURES/10 View in ScopusGoogle Scholar
- [49] D. Borge-Diez, E. Rosales-Asensio, A.I. P.almero-Marrero, E. AcikkalpOptimization of CSP plants with thermal energy storage for electricity price stability in spot markets Energies, 15 (5) (2022), p. 1672, 10.3390/EN15051672 Feb. View in ScopusGoogle Scholar
- [50] F. Trieb, C. Schillings, M. O’sullivan, T. Pregger, and C. Hoyer-Klick, “Global potential of concentrating solar power,” 2009. [Online]. Available: http://eosweb.larc.nasa.gov/sse/. Google Scholar
- [51] J. Pacio, T. WetzelAssessment of liquid metal technology status and research paths for their use as efficient heat transfer fluids in solar central receiver systems Solar Energy, 93 (2013), pp. 11-22, 10.1016/J.SOLENER.2013.03.025 Jul.
- View PDFView articleView in ScopusGoogle Scholar
- [52] K. Vignarooban, X. Xu, A. Arvay, K. Hsu, A.M. K.annanHeat transfer fluids for concentrating solar power systems – a review Appl. Energy, 146 (2015), pp. 383-396, 10.1016/J.APENERGY.2015.01.125 May
- View PDFView articleView in ScopusGoogle Scholar
- [53] P. Kumar, M. Sharma, and A. Prof, “Analysis of heat transfer fluids in concentrated solar power (CSP) a review paper”, Accessed: Nov. 30, 2022. [Online]. Available: www.eere.energy.gov. Google Scholar
- [54] M. Liu, M. Belusko, N.H. S.teven Tay, F. BrunoImpact of the heat transfer fluid in a flat plate phase change thermal storage unit for concentrated solar tower plants Solar Energy, 101 (2014), pp. 220-231, 10.1016/J.SOLENER.2013.12.030 Mar.
- View PDFView articleView in ScopusGoogle Scholar
- [55] J. Birnbaum, et al.Steam temperature stability in a direct steam generation solar power plant Solar Energy, 85 (4) (2011), pp. 660-668, 10.1016/J.SOLENER.2010.10.005 Apr.
- View PDFView articleView in ScopusGoogle Scholar
- [56] J.F. F.eldhoff, et al.Comparative system analysis of direct steam generation and synthetic oil parabolic trough power plants with integrated thermal storage Solar Energy, 86 (1) (2012), pp. 520-530, 10.1016/J.SOLENER.2011.10.026 Jan.
- View PDFView articleView in ScopusGoogle Scholar
- [57] L. Pistocchini, M. MottaFeasibility study of an innovative dry-cooling system with phase-change material storage for concentrated solar power multi-MW size power plant J. Solar Energy Eng., Trans. ASME, 133 (3) (2011), 10.1115/1.4004268 Google Scholar
- [58] Q. Peng, X. Wei, J. Ding, J. Yang, X. YangHigh-temperature thermal stability of molten salt materials Int. J. Energy Res., 32 (12) (2008), pp. 1164-1174, 10.1002/ER.1453 Oct. View in ScopusGoogle Scholar
- [59] A. Modi, F. HaglindPerformance analysis of a Kalina cycle for a central receiver solar thermal power plant with direct steam generation Appl. Therm. Eng., 65 (1–2) (2014), pp. 201-208, 10.1016/J.APPLTHERMALENG.2014.01.010 Apr.
- View PDFView articleView in ScopusGoogle Scholar
- [60] D.Kearney Kearney, A.U. Herrmann, and P. Nava, “Overview on use of a molten salt HTF in a trough solar field (Presentation),” 2003. Google Scholar
- [61] “Therminol VP-1 heat transfer fluid | Therminol | Eastman.” https://www.therminol.com/product/71093459?pn=Therminol-VP-1-Heat-Transfer-Fluid (accessed Nov. 29, 2022). Google Scholar
- [62] “Therminol 62 heat transfer fluid | Therminol | Eastman.” https://www.therminol.com/product/71093437?pn=Therminol-62-Heat-Transfer-Fluid (accessed Nov. 29, 2022). Google Scholar
- [63] “Therminol 66 heat transfer fluid | Therminol | Eastman.” https://www.therminol.com/product/71093438?pn=Therminol-66-Heat-Transfer-Fluid (accessed Nov. 29, 2022). Google Scholar
- [64] “Therminol XP heat transfer fluid | Therminol | Eastman.” https://www.therminol.com/product/71093461?pn=Therminol-XP-Heat-Transfer-Fluid (accessed Nov. 29, 2022). Google Scholar
- [65] “Therminol VP-3 heat transfer fluid | Therminol | Eastman.” https://www.therminol.com/product/71093460?pn=Therminol-VP-3-Heat-Transfer-Fluid (accessed Nov. 29, 2022). Google Scholar
- [66] “Therminol LT heat transfer fluid | Therminol | Eastman.” https://www.therminol.com/product/71093466?pn=Therminol-LT-Heat-Transfer-Fluid (accessed Nov. 29, 2022). Google Scholar
- [67] “Therminol D-12 heat transfer fluid | Therminol | Eastman.” https://www.therminol.com/product/71093448?pn=Therminol-D-12-Heat-Transfer-Fluid (accessed Nov. 29, 2022). Google Scholar
- [68] “Therminol ADX-10 heat transfer fluid | Therminol | Eastman.” https://www.therminol.com/product/71093445?pn=Therminol-ADX-10-Heat-Transfer-Fluid (accessed Nov. 29, 2022). Google Scholar
- [69] “Therminol 54 Heat Transfer Fluid | Therminol | Eastman.” https://www.therminol.com/product/71110854?pn=Therminol-54-Heat-Transfer-Fluid (accessed Nov. 29, 2022). Google Scholar
- [70] “Therminol 55 heat transfer fluid | Therminol | Eastman.” https://www.therminol.com/product/71093433?pn=Therminol-55-Heat-Transfer-Fluid (accessed Nov. 29, 2022). Google Scholar
- [71] “Therminol SP heat transfer fluid | Therminol | Eastman.” https://www.therminol.com/product/71093454?pn=Therminol-SP-Heat-Transfer-Fluid (accessed Nov. 29, 2022). Google Scholar
- [72] “Therminol 59 heat transfer fluid | Therminol | Eastman.” https://www.therminol.com/product/71093435?pn=Therminol-59-Heat-Transfer-Fluid (accessed Nov. 29, 2022). Google Scholar
- [73] “Therminol 68 heat transfer fluid | Therminol | Eastman.” https://www.therminol.com/product/71093442?pn=Therminol-68-Heat-Transfer-Fluid (accessed Nov. 29, 2022). Google Scholar
- [74] “Therminol 72 heat transfer fluid | Therminol | Eastman.” https://www.therminol.com/product/71093443?pn=Therminol-72-Heat-Transfer-Fluid (accessed Nov. 29, 2022). Google Scholar
- [75] “Therminol 75 heat transfer fluid | Therminol | Eastman.” https://www.therminol.com/product/71093444?pn=Therminol-75-Heat-Transfer-Fluid (accessed Nov. 29, 2022). Google Scholar
- [76] “DOWTHERMTM A heat transfer fluid.” https://www.dow.com/en-us/pdp.dowtherm-a-heat-transfer-fluid.238000z.html#tech-content (accessed Nov. 29, 2022). Google Scholar
- [77] “DOWTHERM™ Q heat transfer fluid.” https://www.dow.com/en-us/pdp.dowtherm-q-heat-transfer-fluid.11233z.html?productCatalogFlag=1#tech-content (accessed Nov. 29, 2022). Google Scholar
- [78] “DOWTHERM™ G heat transfer fluid.” https://www.dow.com/en-us/pdp.dowtherm-g-heat-transfer-fluid.25594z.html?productCatalogFlag=1#tech-content (accessed Nov. 29, 2022). Google Scholar
- [79] “DOWTHERM™ RP heat transfer fluid.” https://www.dow.com/en-us/pdp.dowtherm-rp-heat-transfer-fluid.51244z.html?productCatalogFlag=1#tech-content (accessed Nov. 29, 2022). Google Scholar
- [80] A. Alkhalidi, T. Alrousan, M. Ishbeytah, M.A. A.bdelkareem, A.G. O.labiRecommendations for energy storage compartment used in renewable energy project Int. J. Thermofluids, 15 (2022), Article 100182, 10.1016/J.IJFT.2022.100182 Aug.
- View PDFView articleView in ScopusGoogle Scholar
- [81] D.O. Akinyele, R.K. RayuduReview of energy storage technologies for sustainable power networks Sustain. Energy Technol. Assess., 8 (2014), pp. 74-91, 10.1016/J.SETA.2014.07.004 Dec.
- View PDFView articleView in ScopusGoogle Scholar
- [82] M. Aneke, M. WangEnergy storage technologies and real life applications – a state of the art review Appl. Energy, 179 (Oct. 2016), pp. 350-377, 10.1016/J.APENERGY.2016.06.097
- View PDFView articleView in ScopusGoogle Scholar
- [83] A.H. AlamiCompressed-air energy storage Systems Adv. Sci., Technol. Innov. (2020), pp. 67-85, 10.1007/978-3-030-33788-9_7/TABLES/9 Google Scholar
- [84] A.H. AlamiPumped hydro storage Adv. Sci., Technol. Innov. (2020), pp. 51-65, 10.1007/978-3-030-33788-9_6/TABLES/4 View in ScopusGoogle Scholar
- [85] “Gravity storage – a new technology for large scale energy storage.” https://heindl-energy.com/(accessed Oct. 16, 2022). Google Scholar
- [86] A.G. Olabi, et al.Battery thermal management systems: recent progress and challenges Int. J. Thermofluids, 15 (2022), Article 100171, 10.1016/J.IJFT.2022.100171 Aug.
- View PDFView articleView in ScopusGoogle Scholar
- [87] C. Chukwuka, K.A. FollyBatteries and super-capacitors IEEE Power and Energy Society Conference and Exposition in Africa: Intelligent Grid Integration of Renewable Energy Resources, PowerAfrica 2012 (2012), 10.1109/POWERAFRICA.2012.6498634 Google Scholar
- [88] A.K. Rohit, K.P. Devi, S. RangnekarAn overview of energy storage and its importance in Indian renewable energy sector: part I – technologies and comparison J. Energy Storage, 13 (2017), pp. 10-23, 10.1016/J.EST.2017.06.005 Oct.
- View PDFView articleGoogle Scholar
- [89] R. Nagananthini and R. Nagavinothini, “Investigation on floating photovoltaic covering system in rural Indian reservoir to minimize evaporation loss,” https://doi.org/10.1080/14786451.2020.1870975, vol. 40, no. 8, pp. 781–805, 2021, doi: 10.1080/14786451.2020.1870975. Google Scholar
- [90] A.H. AlamiDevelopments of hydrogen fuel cell technologies Int. J. Hydrogen Energy, 46 (8) (2021), p. 5917, 10.1016/J.IJHYDENE.2020.12.039 Jan.
- View PDFView articleView in ScopusGoogle Scholar
- [91] H. Jouhara, A. ?abnie?ska-Góra, N. Khordehgah, D. Ahmad, T. LipinskiLatent thermal energy storage technologies and applications: a review Int. J. Thermofluids, 5–6 (2020), Article 100039, 10.1016/J.IJFT.2020.100039 Aug.
- View PDFView articleView in ScopusGoogle Scholar
- [92] X. Luo, J. Wang, M. Dooner, J. ClarkeOverview of current development in electrical energy storage technologies and the application potential in power system operation Appl. Energy, 137 (2015), pp. 511-536, 10.1016/J.APENERGY.2014.09.081 Jan.
- View PDFView articleGoogle Scholar
- [93] C. Prieto, D.P. O.sorio, E. Gonzalez-Roubaud, S. Fereres, L.F. CabezaAdvanced concrete steam accumulation tanks for energy storage for solar thermal electricity Energies, 14 (13) (2021), p. 3896, 10.3390/EN14133896 Jun. View in ScopusGoogle Scholar
- [94] K.S. Reddy, V. Jawahar, S. Sivakumar, T.K. M.allickPerformance investigation of single-tank thermocline storage systems for CSP plants Solar Energy, 144 (2017), pp. 740-749, 10.1016/J.SOLENER.2017.02.012 Mar.
- View PDFView articleView in ScopusGoogle Scholar
- [95] C. Prieto, L.F. CabezaThermal energy storage (TES) with phase change materials (PCM) in solar power plants (CSP). Concept and plant performance Appl. Energy, 254 (2019), Article 113646, 10.1016/J.APENERGY.2019.113646 Nov.
- View PDFView articleView in ScopusGoogle Scholar
- [96] O. Achkari, A. el FadarLatest developments on TES and CSP technologies – energy and environmental issues, applications and research trends Appl. Therm. Eng., 167 (2020), Article 114806, 10.1016/J.APPLTHERMALENG.2019.114806 Feb.
- View PDFView articleView in ScopusGoogle Scholar
- [97] S. Kuravi, et al.Thermal energy storage for concentrating solar power plants Technol Innov, 14 (2) (2012), pp. 81-91, 10.3727/194982412X13462021397570 Oct. View in ScopusGoogle Scholar
- [98] L. Qoaider, A. LiqreinaOptimization of dry cooled parabolic trough (CSP) plants for the desert regions of the Middle East and North Africa (MENA) Solar Energy, 122 (2015), pp. 976-985, 10.1016/J.SOLENER.2015.10.021 Dec.
- View PDFView articleView in ScopusGoogle Scholar
- [99] R.P. Praveen, M.A. Baseer, A.B. Awan, M. ZubairPerformance analysis and optimization of a parabolic trough solar power plant in the Middle East Region Energies, 11 (4) (2018), p. 741, 10.3390/EN11040741 Mar. View in ScopusGoogle Scholar
- [100] C.S. Turchi, M.J. Wagner, and C.F. Kutscher, “Water use in parabolic trough power plants: summary results from WorleyParsons’ analyses,” 2010. [Online]. Available: http://www.osti.gov/bridge. Google Scholar
- [101] Z. Aqachmar, A. Allouhi, A. Jamil, B. Gagouch, T. KousksouParabolic trough solar thermal power plant Noor I in Morocco Energy, 178 (2019), pp. 572-584, 10.1016/J.ENERGY.2019.04.160 Jul.
- View PDFView articleView in ScopusGoogle Scholar
- [102] O. Ogunmodimu, E.C. OkoroigweConcentrating solar power technologies for solar thermal grid electricity in Nigeria: a review Renew. Sustain. Energy Rev., 90 (2018), pp. 104-119, 10.1016/J.RSER.2018.03.029 Jul.
- View PDFView articleView in ScopusGoogle Scholar
- [103] A. Alkhalidi, K. Alqarra, M.A. Abdelkareem, A.G. O.labiRenewable energy curtailment practices in Jordan and proposed solutions Int. J. Thermofluids, 16 (2022), Article 100196, 10.1016/J.IJFT.2022.100196 Nov.
- View PDFView articleView in ScopusGoogle Scholar
- [104] O. Ayadi, I.A. Alsalhentechno-economic assessment of concentrating solar power and wind hybridization in Jordan J. Ecol. Eng., 19 (2) (2018), pp. 16-23, 10.12911/22998993/81239 Mar. View in ScopusGoogle Scholar
- [105] A. Zurita, et al.Techno-economic evaluation of a hybrid CSP + PV plant integrated with thermal energy storage and a large-scale battery energy storage system for base generation Solar Energy, 173 (2018), pp. 1262-1277, 10.1016/J.SOLENER.2018.08.061 Oct.
- View PDFView articleView in ScopusGoogle Scholar
- [106] J.A. Aguilar-Jiménez, et al.Techno-economic analysis of a hybrid PV-CSP system with thermal energy storage applied to isolated microgrids Solar Energy, 174 (2018), pp. 55-65, 10.1016/J.SOLENER.2018.08.078 Nov.
- View PDFView articleView in ScopusGoogle Scholar
- [107] C.A. Pan, F. DinterCombination of PV and central receiver CSP plants for base load power generation in South Africa Solar Energy, 146 (2017), pp. 379-388, 10.1016/J.SOLENER.2017.02.052 Apr.
- View PDFView articleView in ScopusGoogle Scholar
- [108] A.R. Starke, J.M. Cardemil, R.A. Escobar, S. ColleAssessing the performance of hybrid CSP + PV plants in northern Chile Solar Energy, 138 (2016), pp. 88-97, 10.1016/J.SOLENER.2016.09.006 Nov.
- View PDFView articleView in ScopusGoogle Scholar
- [109] M. Petrollese, D. CoccoOptimal design of a hybrid CSP-PV plant for achieving the full dispatchability of solar energy power plants Solar Energy, 137 (2016), pp. 477-489, 10.1016/J.SOLENER.2016.08.027 Nov.
- View PDFView articleView in ScopusGoogle Scholar
- [110] M. Chennaif, H. Zahboune, M. Elhafyani, S. ZouggarElectric system cascade extended analysis for optimal sizing of an autonomous hybrid CSP/PV/wind system with battery energy storage system and thermal energy storage Energy, 227 (2021), Article 120444, 10.1016/J.ENERGY.2021.120444 Jul.
- View PDFView articleView in ScopusGoogle Scholar
- [111] L. Al-Ghussain, A. Darwish Ahmad, A.M. Abubaker, M.A. HassanTechno-economic feasibility of thermal storage systems for the transition to 100% renewable grids Renew. Energy, 189 (2022), pp. 800-812, 10.1016/J.RENENE.2022.03.054 Apr.
- View PDFView articleView in ScopusGoogle Scholar
- [112] S. Guo, A. Kurban, Y. He, F. Wu, H. Pei, G. SongMulti-objective sizing of solar-wind-hydro hybrid power system with doubled energy storages under optimal coordinated operation strategy CSEE J. Power Energy Syst. (2022), 10.17775/CSEEJPES.2021.00190 Google Scholar
- [113] S. Guo, Y. He, H. Pei, S. WuThe multi-objective capacity optimization of wind-photovoltaic-thermal energy storage hybrid power system with electric heater Solar Energy, 195 (2020), pp. 138-149, 10.1016/J.SOLENER.2019.11.063 Jan.
- View PDFView articleView in ScopusGoogle Scholar
- [114] Y. He, S. Guo, J. Zhou, F. Wu, J. Huang, H. PeiThe quantitative techno-economic comparisons and multi-objective capacity optimization of wind-photovoltaic hybrid power system considering different energy storage technologies Energy Convers. Manag., 229 (2021), Article 113779, 10.1016/J.ENCONMAN.2020.113779 Feb.
- View PDFView articleView in ScopusGoogle Scholar
- [115] Y. He, S. Guo, J. Zhou, F. Wu, J. Huang, H. PeiThe many-objective optimal design of renewable energy cogeneration system Energy, 234 (2021), Article 121244, 10.1016/J.ENERGY.2021.121244 Nov.
- View PDFView articleView in ScopusGoogle Scholar
- [116] J.D. M.cTigue, D. Wendt, K. Kitz, J. Gunderson, N. Kincaid, G. ZhuAssessing geothermal/solar hybridization – integrating a solar thermal topping cycle into a geothermal bottoming cycle with energy storage Appl. Therm. Eng., 171 (2020), Article 115121, 10.1016/J.APPLTHERMALENG.2020.115121 May
- View PDFView articleView in ScopusGoogle Scholar
- [117] J.D. McTigue, et al.Hybridizing a geothermal power plant with concentrating solar power and thermal storage to increase power generation and dispatchability Appl. Energy, 228 (2018), pp. 1837-1852, 10.1016/J.APENERGY.2018.07.064 Oct.
- View PDFView articleView in ScopusGoogle Scholar
- [118] J. Yang, Z. Yang, Y. DuanOptimal capacity and operation strategy of a solar-wind hybrid renewable energy system Energy Convers. Manag., 244 (2021), Article 114519, 10.1016/J.ENCONMAN.2021.114519 Sep.
- View PDFView articleView in ScopusGoogle Scholar
- [119] J. Yang, Z. Yang, Y. DuanCapacity optimization and feasibility assessment of solar-wind hybrid renewable energy systems in China J. Clean. Prod., 368 (2022), Article 133139, 10.1016/J.JCLEPRO.2022.133139 Sep.
- View PDFView articleView in ScopusGoogle Scholar
- [120] G. Brumana, G. Franchini, E. Ghirardi, A. PerdichizziTechno-economic optimization of hybrid power generation systems: a renewables community case study Energy, 246 (2022), Article 123427, 10.1016/J.ENERGY.2022.123427 May
- View PDFView articleView in ScopusGoogle Scholar
- [121] A. Profaiser, W. Saw, G.J. Nathan, P. IngenhovenBottom-up estimates of the cost of supplying high-temperature industrial process heat from intermittent renewable electricity and thermal energy storage in Australia Processes, 10 (6) (May 2022), p. 1070, 10.3390/PR10061070 View in ScopusGoogle Scholar
- [122] X. Han, X. Pan, H. Yang, C. Xu, X. Ju, X. DuDynamic output characteristics of a photovoltaic-wind-concentrating solar power hybrid system integrating an electric heating device Energy Convers. Manag., 193 (2019), pp. 86-98, 10.1016/J.ENCONMAN.2019.04.063 Aug.
- View PDFView articleView in ScopusGoogle Scholar
- [123] Y.L. He, et al.Perspective of concentrating solar power Energy, 198 (2020), Article 117373, 10.1016/J.ENERGY.2020.117373 May
- View PDFView articleView in ScopusGoogle Scholar
- [124] M. Imran Khan, F. Asfand, S.G. Al-GhamdiProgress in technology advancements for next generation concentrated solar power using solid particle receivers Sustain. Energy Technol. Assess., 54 (2022), Article 102813, 10.1016/J.SETA.2022.102813 Dec.
- View PDFView articleView in ScopusGoogle Scholar
- [125] M. Shahabuddin, M.A. Alim, T. Alam, M. Mofijur, S.F. A.hmed, G. PerkinsA critical review on the development and challenges of concentrated solar power technologies Sustain. Energy Technol. Assess., 47 (2021), Article 101434, 10.1016/J.SETA.2021.101434 Oct.
- View PDFView articleView in ScopusGoogle Scholar
- [126] E. Kabir, P. Kumar, S. Kumar, A.A. Adelodun, K.H. K.imSolar energy: potential and future prospects Renew. Sustain. Energy Rev., 82 (2018), pp. 894-900, 10.1016/J.RSER.2017.09.094 Feb.
- View PDFView articleGoogle Scholar
- [127] I. Renewable Energy Agency, Renewable power generation costs in 2019. 2020. [Online]. Available: www.irena.org. Google Scholar
- [128] I. Renewable Energy Agency, Innovation outlook thermal energy storage about IRENA. 2020. [Online]. Available: www.irena.org. Google Scholar
- [129] K. Manickam, et al.Future perspectives of thermal energy storage with metal hydrides Int. J. Hydrogen Energy, 44 (15) (2019), pp. 7738-7745, 10.1016/J.IJHYDENE.2018.12.011 Mar.
- View PDFView articleView in ScopusGoogle Scholar
- [130] Y.L. He, K. Wang, Y. Qiu, B.C. Du, Q. Liang, S. DuReview of the solar flux distribution in concentrated solar power: non-uniform features, challenges, and solutions Appl. Therm. Eng., 149 (2019), pp. 448-474, 10.1016/J.APPLTHERMALENG.2018.12.006 Feb.
- View PDFView articleView in ScopusGoogle Scholar
- [131] N. Jelley and T. Smith, “Concentrated solar power: recent developments and future challenges,” http://dx.doi.org/10.1177/0957650914566895, vol. 229, no. 7, pp. 693–713, Feb. 2015, doi: 10.1177/0957650914566895. Google Scholar
- [132] J. Stekli, L. Irwin, R. PitchumaniTechnical challenges and opportunities for concentrating solar power with thermal energy storage J. Therm. Sci. Eng. Appl., 5 (2) (2013), 10.1115/1.4024143/379849 May Google Scholar
- [133] K. KaygusuzProspect of concentrating solar power in Turkey: the sustainable future Renew. Sustain. Energy Rev.s, 15 (1) (2011), pp. 808-814, 10.1016/J.RSER.2010.09.042 Jan.
- View PDFView articleView in ScopusGoogle Scholar
- [134] V. Kumar, R.L. Shrivastava, S.P. UntawaleFresnel lens: a promising alternative of reflectors in concentrated solar power Renew. Sustain. Energy Rev., 44 (2015), pp. 376-390, 10.1016/J.RSER.2014.12.006 Apr.
- View PDFView articleView in ScopusGoogle Scholar
- [135] K. Sefiane, A. Ko?arProspects of heat transfer approaches to dissipate high heat fluxes: opportunities and challenges Appl. Therm. Eng., 215 (2022), Article 118990, 10.1016/J.APPLTHERMALENG.2022.118990 Oct.
- View PDFView articleView in ScopusGoogle Scholar
- [136] A. Lenert, Y. Nam, E.N. WangHeat transfer fluids Annu. Rev. Heat Transf., 15 (2) (2012), p. 45, 10.1615/ANNUALREVHEATTRANSFER.2012004122 Feb. Google Scholar
- [137] P. Kondaiah, R. PitchumaniProgress and opportunities in corrosion mitigation in heat transfer fluids for next-generation concentrating solar power Renew. Energy, 205 (2023), pp. 956-991, 10.1016/J.RENENE.2023.01.044 Mar.
- View PDFView articleView in ScopusGoogle Scholar
- [138] U. Pelay, L. Luo, Y. Fan, D. Stitou, M. RoodThermal energy storage systems for concentrated solar power plants Renew. Sustain. Energy Rev., 79 (2017), pp. 82-100, 10.1016/J.RSER.2017.03.139 Nov.
- View PDFView articleView in ScopusGoogle Scholar
- [139] G. SadeghiEnergy storage on demand: thermal energy storage development, materials, design, and integration challenges Energy Storage Mater., 46 (2022), pp. 192-222, 10.1016/J.ENSM.2022.01.017 Apr.
- View PDFView articleView in ScopusGoogle Scholar
- [140] Z. Ge, et al.Thermal energy storage: challenges and the role of particle technology Particuology, 15 (2014), pp. 2-8, 10.1016/J.PARTIC.2014.03.003 Aug.
Cited by (0)
© 2023 The Author(s). Published by Elsevier Ltd.
https://doi.org/10.1016/j.ijft.2023.100340