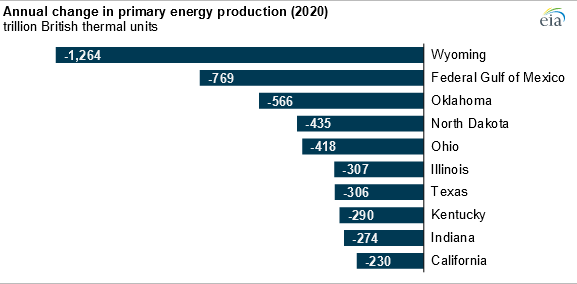
In 2020, energy production in the United States fell by record amounts compared with 2019, mostly as a result of decreased economic activity during the COVID-19 pandemic. Wyoming had the largest drop in total energy production among the states, decreasing by 1,264 trillion British thermal units, mostly due to decreased coal production. Seven states saw their largest annual energy production decline in at least 60 years, as reported in our State Energy Data System.

To calculate U.S. total energy production and to compare different types of energy reported in different physical units (such as barrels, cubic feet, tons, kilowatthours, etc.), we convert sources of energy to common units of heat, called British thermal units (Btu). We use a fossil fuel equivalence to calculate electricity consumption of noncombustible renewables for wind, hydropower, solar, and geothermal.

Data source: U.S. Energy Information Administration, State Energy Data System
U.S. coal production fell by a record 25% in 2020 to its lowest level since 1965. Coal production during 2020 fell by 37% in Indiana, by 33% in Kentucky, and by 21% in Wyoming, as several coal mines closed. In absolute terms, coal production in Wyoming, the nation’s largest coal producer, decreased by more than 1,000 trillion Btu, the most of any state. In 2020, coal production in Arizona stopped entirely with the closure of its last coal mine.
U.S. crude oil production fell by a record 8% in 2020. Production fell in 29 of the 32 states that produce crude oil, in part because of reduced demand for transportation fuels during the pandemic. One notable exception was in New Mexico, where crude oil production increased by 216 trillion Btu (an 11% increase from 2019). New Mexico became the nation’s second-largest crude oil-producing state in 2021.
U.S. marketed natural gas production decreased by less than 1% in 2020, as natural gas demand and prices declined during a slightly warmer year. Marketed natural gas production in Oklahoma decreased by over 300 trillion Btu as shale production in the state fell by nearly 20%. In Ohio, despite a 289 trillion Btu drop in 2020, marketed natural gas production in the state was 31 times larger than in 2010.
U.S. renewable energy production increased by less than 1% in 2020, as solar production increased by 19% and wind by 13%, but biofuels fell by 10% and hydropower by 2%. Hydroelectricity generation in California fell by 45% in 2020, the largest decline of any state, mostly as a result of extensive drought.
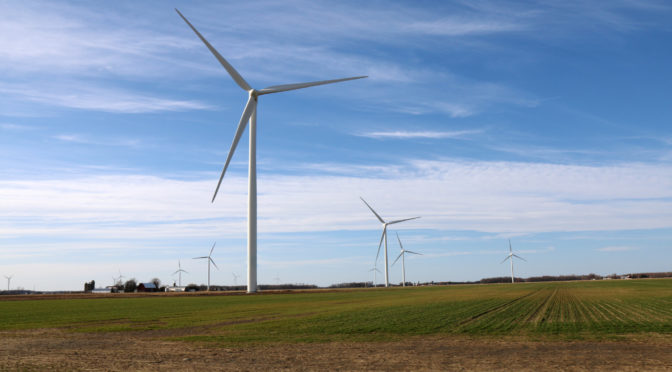
Wind power was the fastest growing electricity source in the US during the first half of 2022, and Texas remains the top wind power market. The Lone Star State deployed 2.2 GW between January and June 2022, which represents 42.3% of wind capacity additions nationwide. This includes the Maverick Creek Wind Project, with a nameplate capacity of 492 MW. Oklahoma also added a major wind farm to the grid – the 999 MW Traverse Wind Project.
Solar power suffered a slowdown, due to an investigation related to module import tariff circumvention. Only 4.2 GW were deployed in January-June 2022, but the growth forecast for the rest of the year is 13.6 GW (17.6 GW total).
For the second half of 2022, the EIA is forecasting that wind capacity will grow by an additional 6 GW, reaching 11.2 GW by the end of the year.
U.S. annual nuclear generation fell by 2% in 2020, mostly because of nuclear power plant closures in Massachusetts (Pilgrim) and Iowa (Duane Arnold).
Principal contributor: Mickey Francis


