
Despite looming challenges and policy uncertainty, the clean power industry started 2022 with a strong first quarter according to the American Clean Power Association (ACP)’s newly released Clean Power Quarterly Market Report Q1 2022.
It was a record first quarter for the industry as clean power owners and developers installed more than 6.6 gigawatts (GW) of new capacity in the United States. While a record first quarter is worth celebrating, the industry experienced slowing growth with projects coming online, projects starting development, and power purchase agreement (PPA) announcements.
Below are the top five takeaways from U.S. clean power activity in the first three months of the year.
1. Clean power deployments remain strong, but begin to slow
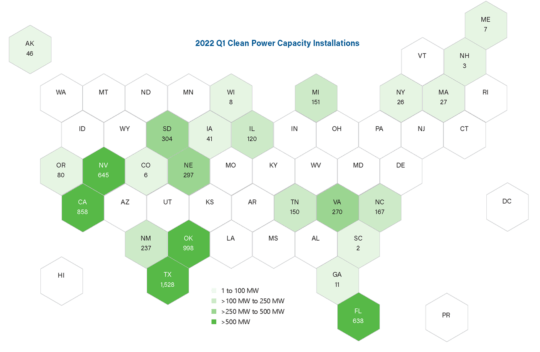
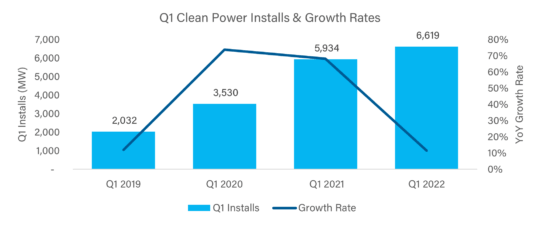
In the first quarter of 2022, the industry installed 6,619 megawatts (MW) of utility-scale clean power capacity – enough to power 1.4 million American homes. The record capacity is largely due to gains in battery storage installation, with storage installations up 173%, solar installations up 11%, and wind installations down 3%, as compared to the first quarter of 2021. Nearly 3 GW of new solar capacity came online this quarter, along with 2,865 MW of land-based wind and 758 MW/2,537 MWh of battery storage capacity. The 90 new projects added to the grid represent $9.3 billion in capital investments.
Developers commissioned 90 new project phases across 24 states this quarter. Texas, a longtime renewable energy leader, led the nation in clean power additions with 1,528 MW of new capacity, followed by Oklahoma (998 MW), California (858 MW), Nevada (645 MW), and Florida (638 MW).
While these gains contributed to a record first quarter for clean power installations, the rate of growth slowed to 11% in the first quarter of 2022, compared to the 50% year-over-year growth rate reported between 2019 and 2021. To reach a net-zero grid by 2035, the industry must be ramping up installations – not slowing down.
2. Industry headwinds begin to impact the development pipeline
The myriad challenges facing the industry – supply chain-related issues, ongoing uncertainty from the Department of Commerce’s solar tariff case, and unnecessary policy uncertainty – are starting to impact the development pipeline. While the industry currently sits on a record volume of clean power capacity in the pipeline, the rate of growth of that pipeline is slowing.
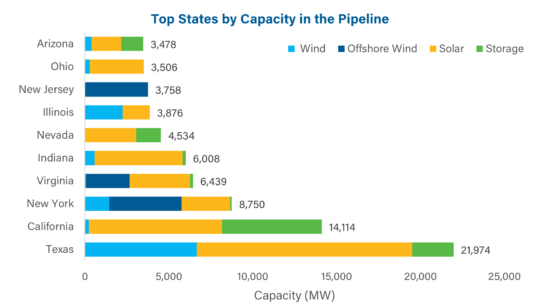
The clean power pipeline grew by just 4% during the first quarter, much lower than the 12% quarterly growth experienced throughout 2021. There are almost 1,100 projects in the U.S. pipeline, for a total capacity of 125,476 MW. This includes 40,522 MW under construction and 84,953 MW in advanced development across America. Of that, solar accounts for 56% of all clean power capacity in development with 69,971 MW. Land-based wind accounts for 19% of the pipeline (23,346 MW), offshore wind represents 14% (17,458 MW), and storage claims the remaining 12% (14,701 MW).
Texas, with 21,974 MW in development, is the top state with clean energy projects underway. The Lone Star State represents nearly a fifth of the total pipeline. California sits in second with 14,114 MW, followed by New York (8,750 MW), and Virginia (6,439 MW).
Trade and tariff concerns, along with lingering supply chain disruptions, challenge the timeline and ultimate fate of many projects in the pipeline. Over 6.5 GW of projects were delayed this quarter, and 8.2 GW of projects that were expected online in 2021 have yet to reach operation. In total, 14.8 GW of capacity has been delayed as of the end of the quarter. On average, project developers are expecting delays of 7 months.
3. Clean power purchasers are more hesitant
Clean power procurement activity slowed during the first quarter. Uncertainties in project development prospects and timelines may have led buyers of clean power to be more cautious in signing new offtake agreements. For the quarter, companies announced 6,339 MW of new PPAs – down 10% from last quarter and 15% from the first quarter of 2021.
Corporate buyers were among those more hesitant to sign on to new clean power PPAs. Commercial & Industrial (C&I) offtakers announced 3,309 MW of new PPAs this quarter, a notable 46% decline from the first quarter of last year. Verizon, announcing 859 MW of new PPAs, was the top corporate purchaser this quarter. The Markley Group came second with 400 MW of PPAs for solar projects signed, and QTS Reality Trust was third with 350 MW of solar PPAs. On the other hand, utilities increased PPA announcements by 53% compared to the first quarter of last year, with 2,513 MW announced. In total, 15 utilities announced PPAs this quarter.
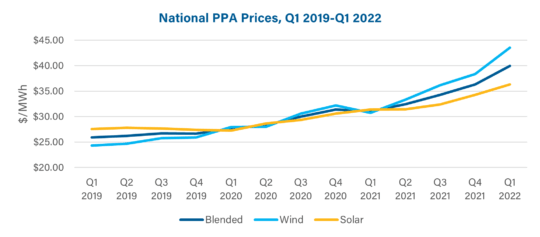
4. PPA prices are on the rise
According to LevelTen, PPA prices rose across all regions and technologies this quarter due to supply chain disruptions and increasing prices of commodities and labor. The war in Ukraine has also impacted the PPA market. Increased gas prices have caused transportation and component assembly costs to rise along every step of the supply chain, which in turn has had a cascading effect on prices for clean power developers.
Additionally, regulatory uncertainty both regionally and nationally has increased prices. ERCOT, PJM, and other regions have enacted and repealed pricing mechanisms, creating new challenges for PPA pricing. Legislation that would drive clean energy deployment and job creation remains stalled in Congress, adding ambiguity as to if and when the tax credits included in the act will come to fruition. Finally, the Auxin Solar case has caused profound uncertainty for U.S. solar developers.
Together, these headwinds have caused uncertainty for developers when setting PPA prices ahead of projects starting construction. For solar, the market average PPA index rose 6% in the first quarter and 15.8% year over year. Wind experienced even more significant increases. The market average price increased by 13.5% since the fourth quarter of 2021 and increased 41.5% year over year.
Even though PPA prices are rising, so are wholesale electricity prices, helping PPAs remain attractive to buyers.
5. The Department of Commerce’s solar inquiry threatens future projects and American solar jobs
While solar installations slowed in the first quarter of 2022 due to pandemic-related challenges in the supply chain, inflation, trade risks, and lack of regulatory certainty, the industry is facing another significant obstacle beyond Q1 with the Department of Commerce’s inquiry into solar manufacturing in Southeast Asia.
This March, the Department of Commerce initiated a review of a petition to apply anti-dumping and countervailing duties against solar module manufacturers located in Southeast Asia, which could ultimately result in retroactively-applied tariffs on up to 80% of solar imports. The uncertainty caused by this unwarranted trade case is having a devastating impact on the U.S. solar industry and its domestic workforce, and is dramatically undercutting the Administration’s emissions and clean energy goals.
In response to the inquiry, ACP surveyed leading utility-solar developers representing 150 active U.S. projects to gather a sample of the market impacts this inquiry is already having on crystalline-silicon PV projects. The survey found that the inquiry has had a chilling effect on the U.S. solar industry – both immediately and over the next two years.
According to ACP’s market impact survey, at least 65% of the projected crystalline silicon (c-si) market across 2022-2023 is already at risk of cancellation or delay. The most common reason for delay or cancellation is the lack of module availability. Prior to Commerce’s decision to initiate this inquiry, market researchers anticipated 17 GWdc of utility-scale solar capacity to be added to the grid in 2022 and nearly 20 GWdc in 2023.
While the inquiry is ongoing, on June 6th President Joe Biden issued an executive order ensuring that no new tariffs can be enforced on solar imports for 24 months, restoring some certainty to these projects and the solar industry. More information is needed on the impact of this executive action on solar projects moving forward and on the results from ACP’s market impact survey.
A speedy resolution to Commerce’s trade case – coupled with legislation stalled in Washington that, if passed, would spur investments in clean energy throughout the country – can unleash our clean energy potential and secure our energy future. Such action would accelerate the development of clean energy projects in the pipeline now and in the future and drive us toward reaching our nation’s climate goals while delivering over 1 million clean energy jobs by 2030 and numerous economic benefits.
ACP uses its proprietary flagship database, CleanPowerIQ, to closely track clean power activity across the nation and provide members with real-time information on the status of clean power projects and manufacturing facilities. CleanPowerIQ data is used to generate ACPs market reports.
ACP Members can dive into more market data and trends from the quarter by downloading the full Clean Power Quarterly Market Report Q1 2022 on our website. To gain access to all of ACP’s member resources, inquire about becoming a member on our website.
Author:
Hana ColwellResearch & Analytics Manager