The weighted average LCOE of Concentrated Solar Power plants fell by 47% between 2010 and 2019, from USD 0.346/kWh to USD 0.182/kWh, excluding two much delayed projects that are not representative of today’s optimised technology configuration that were commissioned in 2019.

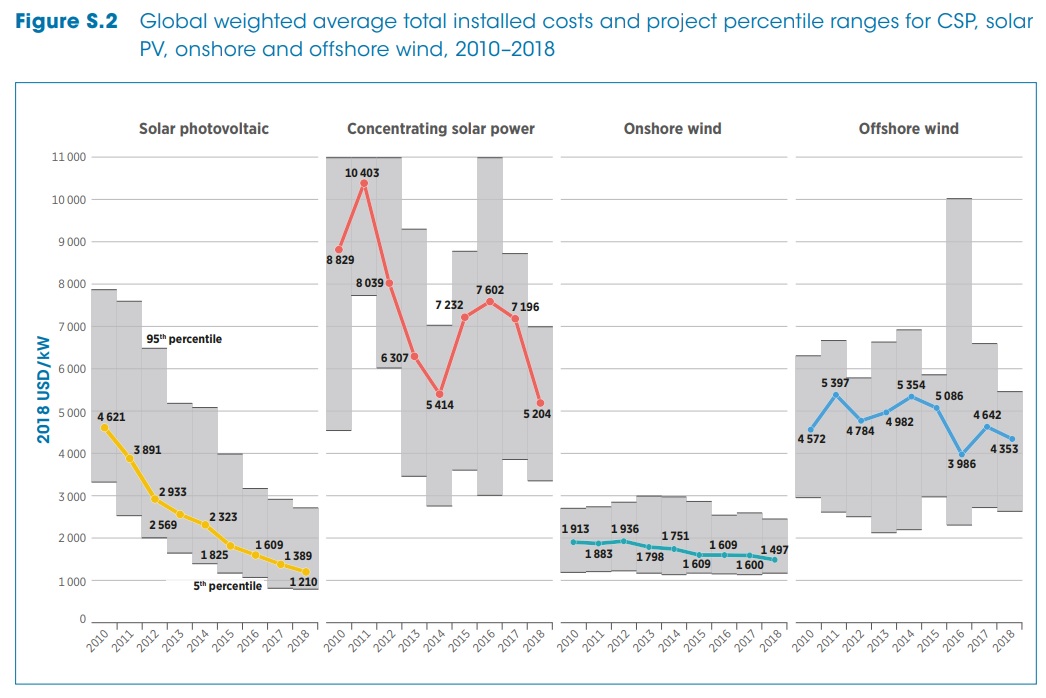
The global weighted-average total installed costs of Concentrating Solar Power plants commissioned in 2019 were USD 5 774/kW – one?tenth higher than in 2018, but 36% lower than in 2010.
The IRENA data shows that during 2018 and 2019, total installed costs ranged between USD 3 183 and USD 8 645/kW for Concentrated Solar Power projects with storage capacities from 4?8 hours.
Projects with eight hours or more of solar thermal storage capacity evidenced a narrower range, of between USD 4,077/kW and USD 5,874/kW.
The capacity factor of solar thermal plants increased from 30% in 2010 to 45% in 2019, as the technology improved, deployment occurred in areas with better solar resources and the average number of hours of storage increased.
Data in the IRENA Auction and PPA Database shows a weighted-average price of electricity of USD 0.075/kWh for CSP projects to be commissioned in 2021. This represents a reduction of 59% when compared to the global weighted-average project LCOE in 2019.

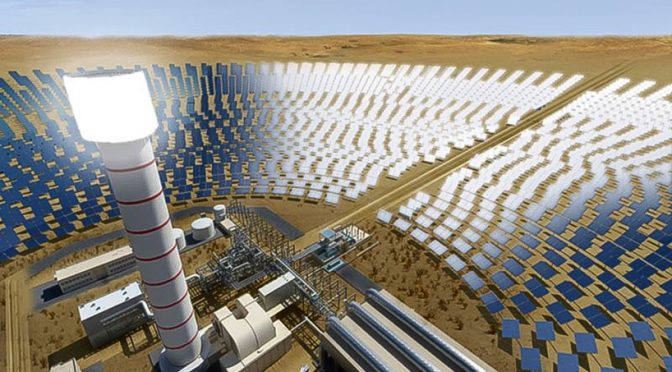
Concentrating solar power (CSP) systems work by concentrating the sun’s rays using mirrors to create heat. In most systems today, the heat created from the sun’s energy is transferred to a heat transfer fluid. Electricity is then generated in a steam cycle, using the heat transfer fluid to create steam an generate as in conventional thermal power plants.
Concentrated Solar Power plants today typically also include low-cost thermal storage systems to decouple generation from the sun. Most commonly, a two-tank molten salt storage system is used, but designs vary.
With reference to the mechanism by which solar collectors concentrate solar irradiation, it is possible
to classify CSP systems into ‘line concentrating’ and ‘focal concentrating’ varieties. This refers to the arrangement of the concentrating mirrors.
The most widely deployed linear concentrating systems are parabolic trough collectors (PTCs).
These systems are made up of parabolic trough shaped mirrors, that are connected together in ‘loops’. The parabolic trough mirrors are also known as collectors and concentrate the solar radiation along a heat receiver tube (absorber).
This is a thermally efficient component placed in the collector’s focal line. Single axis tracking systems are traditionally used to increase energy absorption across the day and ensure the highest temperature feasible for of the heat transfer fluid (often thermal oil) is reached given the intensity of the solar irradiation and the technical characteristics of the concentrators and heat transfer fluid. These transfer the heat through a heat exchange system to produce superheated steam, which drives a
turbine to generate electricity.
Another type of linear focusing Concentrated Solar Power plant, though much less deployed, uses Fresnel collectors. This type of plant relies on an array of almost flat mirrors that concentrate the sun’s rays onto elevated linear receivers above the mirror array.
Unlike parabolic trough systems, in Fresnel collector systems, the receivers are not attached to the collectors, but situated in a fixed position several metres above the primary mirror field Fresnel systems.
Solar towers (STs), sometimes also known as power towers, are the most widely deployed focal point
CSP technology. In these systems, the mirrors are called heliostats (a ground-based array of mirrors).
The heliostat field is arranged in a circular or semicircular pattern around a large central receiver
tower. Each heliostat is individually programmed to track the sun, orientating constantly in two axes
to concentrate solar irradiation onto the receiver located at the top of a tower. The central receiver
absorbs the heat through a heat transfer medium, which turns it into electricity – typically through a
water-steam thermodynamic cycle.
Solar towers can achieve the highest solar concentration factors (above 1 000 suns) and therefore the highest operating temperatures. This gives them and advantage in terms of greater steam cycle generating efficiency and in reducing the cost of thermal energy storage, reducing generating costs and resulting in higher capacity factors.
Cumulative CSP installed capacity grew five-fold, globally, between 2010 and 2019, to reach around
6.3 GW. However, compared with other renewable energy technologies, CSP can still be considered
in its infancy, in terms of deployment. After very modest activity in 2016 and 2017 – with annual additions hovering around 100 MW per year – the global market for CSP grew in 2018 and 2019. In
those years, an increasing number of projects came online in China, Morocco and South Africa.
Yet, new capacity additions overall remained relatively low, at 660 MW per year on average,
during that period.
The sector was optimistic China’s plans to scale up the technology domestically would provide a boost to the industry and take deployment to new levels. China’s policy to support the build-out of
20 commercial-scale plants to scale up a variety of technology solutions, develop supply chains and
gain operating experience included an ambitious timeline for completion. A number of developers were able to meet the required commissioning dates, but many have struggled for a variety of reasons
from land acquisition issues to EPC contractor delays. Despite these delays, a further three projects
are likely to be commissioned in 2020. The industry experience gained from these early projects is likely to be beneficial to future deployment plans and to the further development of the supply chains. If this does turn out to be the case, the global industry may benefit from this, as Chinese suppliers and EPC contractors will put increasing downward pressure on cost structures in projects around the world.
TOTAL INSTALLED COSTS
In the early years of CSP plant development, adding thermal energy storage was often uneconomic and its use was limited. Since 2015, hardly any projects have been built or planned without thermal energy storage, as adding thermal energy storage is now a cost-effective way to raise capacity factors and contributes to a lower LCOE and greater flexibility in dispatch over the day. The average thermal storage capacity for PTC plants in the IRENA Renewable Cost Database increased from 3.3 hours between 2010 and 2014 to 5.7 hours between 2015 and 2019 (an increase of almost three?quarters). For STs, that value increases from 5 hours in the 2010?2014 period to 7.7 hours in the 2015?2019 period (a 54% increase).
Total installed costs for CSP plants have fallen between 2010 and 2019. This has been true even as the projects developed have increased the size of their thermal energy storage systems. During 2018 and 2019, the installed costs of CSP plants with storage were at par or lower – sometimes dramatically so – than the capital costs of plants without storage commissioned in the 2010?2014
period. The projects commissioned in 2018 and 2019 contained in the IRENA Renewable Cost Database had an average of 7.2 hours of storage.
This is 2.2 times larger than the average value for projects commissioned between 2010 and 2014,
and is expected to continue to grow. For instance, the average storage level for projects in the ‘under
construction’ or ‘under development’ categories of the SolarPACES database is 11.7 hours (63% higher than those of 2018-2019) for projects expected to be operational in 2020 and 2021.
The capital costs for CSP for projects for which cost data is available in the IRENA Renewable Cost
Database and that were commissioned in 2019 ranged between USD 3 704/kW and USD 8 645/kW.
16% and 19% higher than in 2018. The data for 2019 include two Israeli projects that were much delayed (one ST and one PTC project). One of these projects was first announced in 2008, with the winning bid succeeding in 2012. These projects continued between 2014 and 2017, using technology and capital cost structures of that time.
Excluding these projects results in capacity weighted-average installed costs of USD 5 774/kW in 2019 – a value 10% higher than in 2018, but 36% lower than in 2010.
Year-on-year variability in average capital costs remains high, however, given the small number of
projects commissioned in each year. During 2018 and 2019, the IRENA’s Renewable Cost Database shows a capital cost range of between USD 3 183/kW and USD 8 645/kW for CSP projects with storage capacities of between 4 and 8 hours. In the same period, the cost range of projects with 8 hours or more of thermal storage capacities was narrower – between USD 4 077/kW and USD 5 874/kW – and had a lower maximum value due to the fact these projects were in China.
CAPACITY FACTORS
The quality of the solar resource is the determining factor, along with the technology configuration,
of the achievable capacity factor for a given location and technology. Adding storage capacity can increase the capacity factor, up to a certain level, given there are diminishing marginal returns.
However, this is a complex design optimisation that is driven by the desire to minimise the LCOE.
The LCOE is being optimised, given the site solar resource, across the storage capacity and the necessary solar field size to minimise LCOE and ensure optimal utilisation of the heat generated.
This is a delicate balance, as smaller than optimal solar field sizes result in under utilisation of the
thermal energy storage system and the selected power block. A larger than optimal solar field size
would add additional capital costs, but with the potential heat generation being curtailed at times
due to lack of storage and generation capacity.
The fact that costs for thermal energy storage have fallen and operating temperatures increased,
has lowered the cost of storage and has increased the optimal level of storage to minimise LCOE in a given location. This has been an important contributor in unlocking increased capacity factor values for CSP plants, in recent years. The capacity factor values for projects in IRENA’s Renewable Cost Database during 2018 and 2019 ranged from 19% to 57%.
The CSP market has experienced a shift from areas with lower solar resources in its early years, towards project development in areas with higher irradiation – a level typically referenced by the
annual Direct Normal Irradiance (DNI) metric.
Projects with higher DNI levels than the early facilities developed in Spain have come online in a wide range of high?resource locations, such as Morocco, Chile and South Africa. Besides the increased storage capacity trend – which has sometimes made up for lower DNI availability (e.g.
in the case of China) – the shift towards high DNI locations has been an important driver of increased
CSP capacity factors.
High heat transfer fluid (HTF) temperatures can also contribute to lower storage costs. For a given DNI level and fixed plant configuration conditions, higher HTF temperatures allow for a larger temperature differential between the ‘hot’ and ‘cold’ storage tanks that means greater energy (and hence storage duration) can be extracted for a given physical storage size, or less storage medium volume is needed to achieve a given number of storage hours.
OPERATION AND MAINTENANCE COSTS
All-in O&M costs that include insurance and other asset management costs for CSP plants are substantial compared to solar PV and onshore wind energy.
The typical range of O&M costs for CSP plants in operation today, with some exceptions, is in the range USD 0.02/kWh to USD 0.04/kWh. This is likely a good approximation for the range of O&M in relevant markets, globally today, even if based on an analysis relying on a mix of bottom-up engineering estimates and best-available reported project data.
However,
IRENA analysis for a range of markets suggests for projects which achieved financial close in 2019, more competitive O&M costs are possible in some markets.
Although the O&M costs in absolute terms are high compared to solar PV and many onshore wind farms per kWh, the higher LCOEs of CSP plants today mean that the overall share of O&M is not as high as might be expected. Analysis conducted by IRENA in collaboration with DLR, found that in 2019, O&M costs averaged about 18% of the LCOE for projects in G20 countries.
Historically, the largest individual O&M costs for CSP plants were the expenditures for receiver and
mirror replacements. As the market has evolved, new designs and improved technology have helped reduce failure rates for receivers and mirror breakage, driving down these costs. Insurance costs also remain an important contributor to O&M costs.
Though partly dependant on how secure the project location may be, these typically range between 0.5% and 1% of the initial capital outlay (a figure that is lower than the total installed cost).
O&M costs vary from location to location, however, given differences in irradiation, plant design,
technology, labour costs and individual market component pricing, linked to local costs differences.
Upcoming analysis for G20 countries provides estimates for a wider range of markets than the data reported historically. This has the advantage of indicating possibilities in deploying CSP in previously undeveloped markets.
The results indicate that in those markets presented, the overall range of insurance?included O&M costs is likely to be within the USD 0.011/kWh to USD 0.032/kWh range.
Most markets evaluated in the analysis seem to be able to achieve costs closer to the lower bound of that range, however, in a sign of improved competitiveness in total running costs.
LEVELISED COST OF ELECTRICITY
Lower total installed costs and higher capacity factors are driving the decline in the cost of electricity from CSP. The LCOE of CSP between 2010 and 2012 stayed relatively stable, at a global weighted average of between USD 0.346/kWh and USD 0.353/kWh.
With the additional deployment of about 800 MW in Spain and a few projects in the United States and other markets, in 2012, the LCOE increased over that of 2010 and the range widened.
From 2013 onwards, however, a downward trend in the LCOE of projects become clearly visible.
Data from IRENA’s Renewable Cost Database shows weighed?average LCOE estimates by project during 2013?2015 about one third lower than observed in the 2010-2012 period. After 2012, the CSP market also shifted away from Spain to newer markets with higher solar resources.
Rather than technology learning effects alone, it is more likely, then, that that these higher DNIs offer a more predominant explanation of the lower LCOEs during that second period.
Yet, while a shift towards project locations with higher DNIs was a major contributor to the increased capacity factors (and therefore lower LCOE values) seen after 2012, the increasing capacity factor trend is also related to a move towards plant configurations with higher storage capacities and theability to be more freely dispatched over the day.
In 2016 and 2017, only a handful of plants were completed, with around 100 MW added in each year. The results for these two years are therefore volatile and driven by the specific plant costs.
The increase in LCOE in 2016 was driven by the higher costs of the early projects in South Africa and Morocco commissioned in that year. In 2017, the global weighted-average LCOE returned to levels more consistent with those experienced in the 2013 to 2015 period. This was driven newer South African CSP projects with lower costs than the first plants, while there was also deployment in
China – which has lower cost structures.
The clear downward trend in the cost of electricity from CSP was reinforced in 2018 and 2019, as market deployment regained its 2014 level and yearly installations again exceeding the 600 MW
mark. Coinciding with this market uptake, IRENA’s Renewable Cost Database shows that – excluding the two discussed Israeli projects – the LCOE of PTC and ST projects commissioned in 2018 and 2019 ranged between USD 0.100/kWh and USD 0.243/kWh (consistently below the 2017 value).
In 2019, the global weighted-average LCOE of CSP plants declined 1% from its value in 2018 and 47% from its value in 2010, when the influence of the two Israeli projects coming online during 2019 is excluded.
Despite relatively thin deployment compared to other technologies, the CSP market is likely to continue experiencing a downward trend in the cost of electricity, as indicated by the evolution
of PPA announcements for CSP projects, due to come online in 2020 and 2021. These are also
increasingly within the lower end of the fossil fuel range.
Data in the IRENA Auction and PPA Database shows a weighted-average price of electricity of between USD 0.075/kWh and USD 0.094/kWh for CSP projects to be commissioned in 2020 and 2021. This represents a reduction of 48% to 59%, compared to the global weighted-average project LCOE in 2019.
These figures should be interpreted with care, however, since they are not directly comparable with the LCOE metric discussed here. Yet, these announcements do point towards the increased competitiveness of CSP projects, compared to fossil fuel alternatives.
With CSP costs likely to continue to decline, the technology can play an important role in a transition
towards higher shares of VRE in electricity markets with excellent solar resource. CSP, with its lowcost, long-duration thermal energy storage and the technology’s ability to be dispatched when
required, make it a complementary technology to solar PV and onshore wind power.
Although PPA details, including the agreed price, have been made available for some projects, comparing LCOE and PPA and auction data can be challenging. Yet, discussing their differences can also shed light on trends in competitiveness for a given technology. A notable example of such announced PPA details is Phase 4 of the Mohammed bin Rashid Al Maktoum Solar Park, located in Dubai. This project, which was tendered by the Dubai Electricity and Water Authority (DEWA), represents a step-change in CSP project competitiveness.
The project consists of 600 MW of PTC and 100 MW of ST capacity.35 This is to be commissioned in stages, starting from the fourth quarter of 2020. The PPA price has been announced as USD 0.074/kWh for a duration of 35 years.
Both these numbers are exceptional. They are also different from the benchmark conditions used for the LCOE calculation in this study, which assume 7.5% WACC and 25 years of economic life.
In order to understand this PPA price and how it was achieved, an analysis of the different factors that see it deviate from the estimated LCOE of a benchmark CSP plant are given. The analysis takes as a starting point a reference plant in Dubai, based on a plant configuration for the PTC elements similar to the latest Moroccan Noor design, a 25 year economic life and a WACC of 7.5%. The chart then examines how the DEWA project then deviates from these parameters in order to achieve such a competitive auction price.
The project consists of 86% PTC technology, while a single ST will provide the remaining CSP. This will slightly increase costs compared to using PTC exclusively in Dubai, but not materially. The calculations for the economic life, learning rates and access to competitive financing are robust and based on publicly available information. The access to very competitive financing for the project is the largest contributor to the cost difference, followed by the long economic life and the learning effects that reduce costs. The remaining contribution to the very low PPA price is likely to be the result economies of scale this exceptionally large project has, from benefits from building the plant
in stages with the same work force on the same site, through to better prices for procuring equipment, favourable production guarantee conditions, etc.