The global wind power market expanded 19% in 2019, with around 60 GW of new capacity added to the world’s electric grids (including more than 54 GW onshore and over 6 GW offshore).
This was the second largest annual increase in capacity ever, and followed three consecutive years of decline after the peak in 2015 (63.8 GW).
Offshore wind power plays an increasingly important role in the global market, accounting for a record one-tenth of additions in 2019.
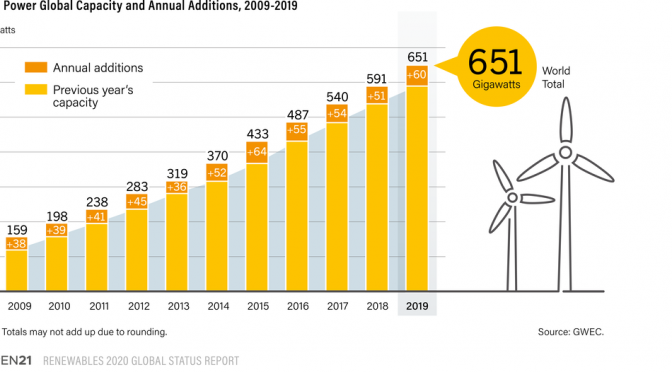
The year’s newly installed wind power capacity increased the global total by 10% to around 651 GW overall (621 GW onshore and the rest offshore).
Figure 37


The rapid growth in 2019 was due largely to surges in China and the United States in advance of policy changes and to a significant increase in Europe, despite continued market contraction in Germany.
Some emerging markets experienced slowdowns due to delays in public tenders and stop-and-go policies, which have deterred investment, although several markets in Africa, Latin America, the Middle East and Southeast Asia saw notable growth relative to 2018.
New wind farms reached full commercial operation in at least 55 countries during 2019, up from 47 in 2018, and at least one country, Senegal, brought online its first commercial project.
By year’s end, the number of countries with some level of commercial wind power capacity exceeded 102, and 35 countries – representing every region – had more than 1 GW in operation.
Rapidly falling costs per kilowatt-hour (both onshore and offshore) have made wind energy ever more competitive and allowed onshore wind power to compete head-to-head with fossil fuel generation in a large and growing number of markets around the world, often without financial support. The economics of wind energy have become the primary driver for new installations.
Outside of China (which has a feed-in tariff, or FIT, for wind power) and the United States (which offers tax credits and state renewable portfolio standards, or RPS), global demand for wind power in 2019 was driven largely by other policy mechanisms including auctions (or tendering), which have exerted a downward pressure on prices. In some mature markets – such as in North America (around 80% of the global market) and northern Europe – corporate power purchase agreements (PPAs) are playing an ever more important role; worldwide, newly signed PPAs during 2019 were up an estimated 30% compared with 2018.
Wind power provides a substantial share of electricity in a growing number of countries.
Wind power provides a substantial share of electricity in a growing number of countries. In 2019, wind energy generated enough to provide an estimated 15% of the EU’s annual electricity consumption, and equal or higher shares in at least seven individual Member States.
Wind energy met an estimated 47% of Denmark’s electricity demand in 2019 and accounted for nearly 57%i of the country’s total generation. Other countries in Europe with wind generation shares above 20% for all of 2019 included Ireland (32%), Portugal (26.4%), Germany (21.8%) and Spain (20.9%).
Uruguay (29.5%), Nicaragua (17.4%) and Costa Rica (15.8%) also achieved high shares of generation from wind energy in 2019, and shares were high at the sub-national level in several countries.
By year’s end, wind power capacity in operation worldwide was enough to provide an estimated 5.9% of total global electricity generation.
For the 11th consecutive year, Asia was the largest regional market, representing more than 50% (down from 52% in 2018) of added capacity, with a total exceeding 292 GW by the end of 2019.
Europe (24%), North America (16%) and Latin America and the Caribbean (6%) accounted for most of the rest of the year’s installations.
China retained its lead for new capacity (both onshore and offshore) and was followed distantly by the United States, the United Kingdom and India (both adding almost equal amounts) and Spain; together, these five countries accounted for 70% of annual installations. Other countries in the top 10 for total capacity additions were Germany, Sweden, France, Mexico and Argentina. For cumulative capacity, the top 10 countries were unchanged from 2018.
Figure 38

 ource: See endnote 22 for this section.
China again saw an increase in new installations (up 22%) during 2019, adding around 26.8 GW (24.3 GW onshore and 2.5 GW offshore) for a total of 236.3 GW installed. More than 25.7 GW (23.8 GW onshore and nearly 2 GW offshore) of wind power capacity was integrated into the national grid in 2019, with just over 210 GW considered officially grid-connected by year’s end.
China’s support through the FIT (and its looming expiration), as well as the country’s first wind power auction, drove the domestic market in 2019.25 In May, the national government announced that, starting in 2021, FITs for onshore wind generation will no longer exceed those provided for coal-fired generation. The government also published an initial list of approved projects (totalling 5.7 GW) to be built without direct financial support. The policy changes result from a belief that the wind energy sector is mature enough to proceed without direct government support, as well as the need to clear a backlog of outstanding FIT payments for existing projects.
Although the northern and western provinces were still home to the majority of China’s cumulative capa-city by year’s end, the top provinces for official grid-connected additions in 2019 were Henan (nearly 3.3 GW),Hebei (2.5 GW), and Shanxi and Shandong (2.1 GW each), with Jiangsu in the lead for offshore installations – all of which are relatively close to demand centres and where curtailment rates were relatively low.
Overall, an estimated 16.9 TWh of potential wind energy was curtailed in China – a national average of 4% for the year, down from 7% (27.7 TWh) in 2018, and below the national government’s targeted cap (10%) for 2019.
Curtailment remained concentrated mainly in Xinjiang, Gansu and Inner Mongolia, but all three provinces saw substantial reductions relative to 2018.
China’s generation from wind energy was up nearly 11% (to 405.7 TWh), and wind energy’s share of total generation continued its steady rise, reaching 5.5% in 2019 (up from 5.2% in 2018).
India was the only other Asian country to rank among the top 10 for installations of wind power capacity in 2019, placing fourth globally for additions and for total capacity. The country’s additions increased 8.5% over 2018, when installations fell nearly 50% from their record high in 2017, as India shifted from FITs to reverse auctions. India added 2.4 GW in 2019, bringing the year-end total to 37.5 GW. Another 8.6 GW was in the active pipeline at year’s end, but many wind (and other) power projects have been delayed by problems obtaining land and accessing transmission lines.
Although the issuance of tenders remained strong in India during 2019, many were cancelled or undersubscribed, and projects that were already tendered faced delays (due to efforts to renegotiate for lower tariffs or to outright withdrawal of existing PPAs), which have held up turbine deliveries and put significant pressure on the domestic manufacturing industry. Among the many challenges deterring investment have been policy uncertainties, India’s slowing economy, aggressive bidding, low ceiling tariffs for auctions, curtailment and infrastructure constraints, delayed payments for generation, lack of low-cost financial resources, lack of available land in good wind areas (where developers want to be, due to low wind energy tariffs) and duties and tariffs on imports. The number and diversity of local investors has declined since the shift to auctions, while installations have become more concentrated geographically.
Elsewhere in Asia, Turkey’s annual installations increased relative to 2018, with nearly 0.7 GW added for a total exceeding 8.1 GW. Wind energy accounted for 7.4% of Turkey’s electricity generation in 2019. Thailand placed fourth in the region (added 0.3 GW for a total of 1.5 GW), although its market contracted after a significant drop in FIT rates dampened investor confidence. Other Asian countries that added capacity included Japan (adding nearly 0.3 GW for a total of 3.9 GW), the Republic of Korea, Pakistan and Vietnam. Vietnam’s capacity increased 70% (to 388 MW) in a rush to complete projects before generous FIT rates were reduced, and wind power projects competed with solar PV and conventional power projects for space on the country’s grid networks.44 In much of Southeast Asia, policy uncertainty and subsidies to fossil fuels continued to curb deployment.
After Asia, Europe installed the most capacity of any region during 2019. All of Europe added nearly 14.7 GW of new wind power capacity, bringing the total to 196.8 GW.
Most of this was in the EU-28, which installed roughly 13.2 GW (9.6 GW onshore and 3.6 GW offshore), or net additions of 13 GW (accounting for decommissioning), for a year-end total of 192.2 GW (170.2 GW onshore and 22.1 GW offshoreiv).
Net EU additions, although below the all-time high in 2017, were up 34% over 2018. The sharp increase was due mainly to strong growth in Greece (added a record 0.7 GW), Spain and Sweden – which more than doubled its additions relative to 2018, installing 1.6 GW for a total of 9 GW.49 In total, 19 EU countries added capacity during 2019, up from 16 countries in 2018. However, the market was again fairly concentrated, with the top five countries – the United Kingdom, Spain, Germany, Sweden and France – accounting for almost 75% of net additions, even though markets in France and Germany contracted for the second consecutive year. The leading EU countries for cumulative capacity were Germany, Spain, the United Kingdom, France and Italy.
Net installations of wind power capacity in the EU-28 were up 34% over 2018.
The United Kingdom was the region’s top installer in 2019, adding 2.4 GW, three-quarters of which is operating offshore, for a total of 23.5 GW. Most new onshore capacity (0.6 GW) was added in Scotland and Wales, and was awarded under Contracts for Differencevii (CfD) in 2015.
Elsewhere in the United Kingdom, wind energy projects rely on merchant options such as PPAs. The country saw historic lows for generation from coal (less than 1% for the second quarter of 2019), due largely to the rise of wind power, which accounted for nearly 20% of domestic electricity generation during the year.
Spain, which ranked second in the region and fifth globally for installations, had its best year in a decade. The country added 2.3 GW (all onshore) – more than five times its 2018 installations – to end 2019 with 25.8 GW. While most of this capacity was awarded in auctions held in 2016 and 2017, Spain also led the region for investments in new onshore capacity. In late 2019, to mitigate regulatory uncertainty regarding future revenue from renewable power plants, the national government introduced a series of measures in an effort to guarantee a stable economic and regulatory framework to encourage further investment in renewable energy projects.
Although still among the EU’s top installers, Germany saw a sharp decline in annual additions (as well as in investment in new projects), ceding its first-place ranking in Europe, held since 2011.
Germany added 2.2 GW (nearly 2.1 GW net, including almost 1 GW onshore and 1.1 GW offshore) in 2019 for a cumulative 61.4 GW (53.9 GW onshore and more than 7.4 GW offshore). Onshore installations have declined markedly since the 2014-2017 period (to 16% of the volume in 2017, when the auction model was introduced), due mainly to long, complex permitting processes and policy uncertainty.
As of late 2019, more than 10 GW of wind power projects was stuck in Germany’s permitting process, which has lengthened from around 10 months just a few years ago to more than two years. The largest permitting barriers relate to aviation and the military; in addition, rising public opposition and a proposed setback distance of 1,000 metres for wind turbines have ruled out several prime locations.
Growing economic risk, the increased complexity associated with tenders, permitting challenges and the threat of legal action have deterred potential investors, including community wind energy actors, and the removal of some privileges for community projects has reduced the number and diversity of participants in auctions. Of the total 3.7 GW of onshore capacity auctioned in 2019, only 1.8 GW was awarded – far below the volume envisioned in Germany’s expansion plan. The number of companies active in the domestic wind power industry has declined with new installations, affecting the entire local value chain.
Germany’s gross generation from wind energy was up 12% onshore and 27% offshore, reaching a total of 126 TWh, or 21.8% of electricity generation in 2019. Much of this electricity is produced in northern Germany, and a lack of grid capability hinders the transmission of excess electricity to load centres in the country’s south, resulting in curtailment of wind energy and challenges for neighbouring countries due to electricity exports. Curtailment in Germany has declined since 2017, however, as have exports, and the country has completed the first 1,300 kilometres of 7,700 kilometres of new transmission lines planned by 2030.70 In Germany and elsewhere, interest in the use of excess renewable generation for electric heating, cooling and transport as well as for hydrogen production is quickly gaining ground.
For the EU as a whole, onshore wind energy met around 12.2% of total electricity demand, and offshore wind energy met 2.3%, with an estimated total of 417 TWh of wind generated electricity. The one percentage point share increase relative to 2018 resulted from additional capacity and from windy conditions during the year throughout the region.
Outside the EU-28, Norway was again the largest installer in Europe (adding 0.8 GW) in 2019. However, Norway’s plans for future installations were put on hold due to local opposition across the country sparked by environment and tourism concerns. Ukraine saw a nearly 10-fold increase in installations relative to 2018 (adding 0.6 GW), more than doubling its capacity to 1.2 GW in advance of a transition from attractive FITs to auctions in 2020. Throughout all of Europe, 2.1 GW of wind power PPAs were signed, and 10 countries held auctions in which wind energy secured contracts, including 8.6 GW onshore and 6.8 GW offshore.
Across the Atlantic, the Americas added 13.4 GW (up 13% over 2018) and accounted for more than one-fifth of the world’s newly installed capacity in 2019.
The United States installed 68% of the region’s total and had its third biggest year. US additions were up 20% over 2018, to 9.1 GW, for a total of 105.6 GW across 41 states and 2 territories. At year’s end, another 22.1 GW was under construction. The rush of new installations was driven mainly by the phase-out of the federal production tax credit (PTC), which was granted a one-year extensionxi in late 2019.
Demand from utilities to meet customer preferences, sustainability goals and mandates under state RPS laws as well as demand from corporations also played a role. Wind power PPAs achieved a new record (8.7 GW) in 2019, with utilities contracting 5.1 GW; at year’s end, almost half of the project pipeline had a PPA in place, with 27% of these owned by utilities.
The state of Texas (nearly 4 GW) again led for annual installations and, along with Iowa (1.7 GW), set new records for capacity additions. Six US states ended the year with more than 5 GW in operation – including Texas, with more than 28.8 GW.
In Texas and much of the rest of the country, wind power set short-term generation records, exceeding 66% in the US central region, and grid operators were reliably managing such high penetration levels.
Tests by the California Independent System Operator during 2019 found that wind turbines equipped with inverter-based smart controllers can provide grid services similar to those provided by natural gas power plants.
For the full year, utility-scale wind power facilities accounted for more than 30% of electricity generation in 3 US states – with Iowa (in the lead at 42%) passing Kansas (41.4%) – and accounted for more than 16% of annual generation in 13 states. In total, wind power accounted for 7.3% of US utility-scale electricity generation (up from 6.5% in 2018). As an indication of how big wind power has become in the United States, it exceeded hydropower for generation in 2019, having already surpassed it for capacity three years earlier.
Latin America and the Caribbean added 3.7 GW of capacity in 2019, with two countries – Mexico and Argentina – ranking among the top 10 globally. The slight decline relative to 2018 was due mainly to a significant drop in Brazil that was nearly offset by increases elsewhere. The region ended the year with around 29.2 GW of wind power capacity operating in at least 26 countries. The top installers were Mexico (nearly 1.3 GW) and Argentina (0.9 GW), which both surpassed Brazil (0.7 GW) in annual additions for the first time, followed by Chile (0.5 GW). Colombia held its first successful renewable energy auction, in which wind power was awarded nearly 1.2 GW.
More than 80% of the non-hydro renewable power capacity operating across the region (mostly wind power) at year’s end was driven by public tenders and auctions, and PPAs also were becoming increasingly important.
Mexico was again among the world’s top 10 installers, ranking ninth for additions ahead of Argentina, and ending the year with 6.2 GW.
The country cancelled planned auctions and revised its renewable energy support scheme, and annual installations (up 38% over 2018) were due mainly to bilateral PPAs.
Argentina’s market also has been affected by on-and-off policies but, thanks to awarded capacity from auctions launched between 2016 and 2018, the country more than doubled its capacity to end the year with 1.6 GW.
Argentina’s largest wind farm (220 MW) was completed in 2019; the project has an average capacity factor of 51%, and is expected to supply enough electricity for more than 330,000 homes.
Brazil added its lowest amount of wind power capacity since 2011, due to a break in the country’s auction schedule during the recent national economic crisis; even so, by one account, more wind power than thermal power capacity was installed in 2019. Brazil’s free market has expanded in recent years, and in 2019 more than 2 GW of new wind power capacity was sold into the free market compared to 1.1 GW via public auctions. At year’s end, with almost 15.5 GW of capacity in operation, Brazil remained home to more than half of the total capacity operating in Latin America and the Caribbean.104 Wind power accounted for 9.4% of Brazil’s electricity generation (up from 8.3% in 2018).
Canada again added a modest 0.6 GW, bringing total capacity to 13.4 GW. Wind power has been the country’s largest source of new electricity generation over the past decade, driven by environmental concerns and by the relatively low price of wind-generated electricity. The leading provinces for cumulative capacity were Ontario (5.4 GW), Quebec (3.9 GW) and Alberta (1.7 GW). Wind power accounted for 6.5% of Canada’s electricity generation in 2019, up from 5.8% in 2018.
Wind energy is also playing a growing role in Australia, which again saw records for both installations and output in 2019. The country brought online more than 0.8 GW of capacity for a total approaching 6.3 GW. Wind power surpassed hydropower in 2019 to become Australia’s largest renewable source of electricity, producing 19.5 TWh, or 8.5% of the country’s total generation. Far higher shares were achieved in several states, including in South Australia (29%), Victoria (28%) and New South Wales (22.6%). The rapid increase in the number and capacity of large wind (and solar) power projects in Australia continued to challenge the grid, resulting in project delays.
By year’s end, more than 5.5 GW of additional capacity was under construction or financially committed. Other parts of Oceania were quiet, with little wind power activity observed in 2019.
Africa and the Middle East together added about 2.6% less capacity than they did in 2018, with around 0.9 GW brought online in 2019. At year’s end, 13 countries in Africa and 6 in the Middle East had a cumulative 6.7 GW of wind power capacity (all onshore), with most of it in South Africa (2.1 GW), Egypt (1.5 GW) and Morocco (1.2 GW). Challenges in both regions included uncertain or unsupportive policy and power market frameworks, bottlenecks in transmission infrastructure and off-taker risk.
In Africa, the leadersxi for new installations were Egypt (262 MW), Morocco (216 MW) and Ethiopia (120 MW).
Egypt’s additions were in a single project, the country’s largest and first privately owned wind farm. Despite being among the top three on the continent for additions and total capacity, Egypt remained far short of its target of 7 GW by 2022, but the country had a project pipeline of 4 GW as of early 2020.
Senegal also added capacity: its first utility-scale wind farm (159 MW) began delivering electricity to the grid in December, with full commissioning planned for 2020.
Jordan (0.2 GW) and Iran (50 MW) led the Middle East for new installations during 2019.
Saudi Arabia’s government contracted for the country’s first large-scale wind power plant, a 0.4 GW facility with an expected operation date of early 2022. The Saudi government aims to free up for export much of the oil used to generate electricity.
In the offshore wind power segment, five countries in Europe and three in Asia connected a record 6.1 GW in 2019 (up 35.5% over 2018), increasing cumulative global capacity to more than 29 GW. Wind turbines operating offshore represented less than 5% of total global wind power capacity at year’s end, but offshore additions accounted for 10% of all newly installed capacity (up from 5% in 2015), and 2019 was a record year for investment in future offshore capacity. Europe accounted for 59% of new installations and Asia for 41%.
China again led the sector, completing nearly 2.4 GW of capacity for a total of 6.8 GW, and easily surpassing a national target of 5 GW by 2020.
Record installations were driven by policy changes: for the first time, China announced reductions to the FIT for offshore wind power for 2019, and further cuts in 2020, and several new projects were initiated to take advantage of the policy before it expires. Although the country has no long-term targets for offshore capacity, coastal provinces have targets and development plans, including Guangdong (30 GW by 2030), Jiangsu (15 GW) and Zhejiang (6.5 GW). At year’s end, more than 10 GW was under construction and an additional 30 GW had received approval.
Elsewhere in Asia, Chinese Taipei commissioned its first offshore utility-scale (120 MW) project and announced that, in addition to its target of 5.7 GW by 2025, the country aims for a further 10 GW between 2026 and 2036. Japan launched 3 MW of floating capacity to end the year with nearly 66 MW of offshore capacity and 14 GW in the pipeline; Vietnam had 0.1 GW of intertidal capacity with several projects under construction; and India launched a tender process for offshore wind power.
Offshore wind power additions accounted for 10% of all newly installed capacity, up from 5% in 2015.
Europe continued to be home to most of the world’s offshore capacity. In 2019, the region added more than 3.6 GW (up 36% from 2018), a new high, bringing the regional total close to 22.1 GW. Installations came online in the United Kingdom (1.8 GW), Germany (1.1 GW), Denmark (374 MW), Belgium (370 MW) and Portugal (8 MW); all but Germany set new records.
The United Kingdom accounted for about half of Europe’s offshore installations and reached a year-end total of 9.9 GW offshore. All turbines were grid-connected for the UK’s 1.2 GW Hornsea One, making it the world’s largest offshore wind farm as well as the farthest from shore. Germany added more capacity offshore than on land, for the first time, and exceeded the national offshore target for 2020.
Several European governments also increased targets for offshore wind power, driven at least in part by falling prices, raising the region’s total targeted capacity by 2030 from 76 GW to 100 GW. France, the Netherlands and the United Kingdom all held auctions for offshore capacity during 2019, including the world’s largest-ever offshore auction – 5.5 GW was awarded by the UK government. An additional five offshore corporate PPAs were signed, following the first in 2018, totalling more than 360 MW of future capacity. In Sweden, however, a proposed 300 MW offshore wind farm that was permitted in 2012 was cancelled after the national military rejected revised plans.
The US offshore capacity remained at 30 MW, but targets for state procurement increased from 9.1 GW in 2018 to 25.4 GW in 2019. Vineyard Wind, a 0.8 GW project off the Massachusetts coast, was scheduled to begin construction in 2019, but was delayed repeatedly for further government study of the broader impacts of offshore wind farmsxii on commercial fisheries. The project is the first in a long pipeline of large wind farms along the country’s east coast, and the delay has caused wider uncertainty in the US offshore market. However, construction did begin on a 12 MW project off Virginia’s shores, and by year’s end an estimated 7.5 GW was in advanced development xiii along the US east coast. During the year, six east coast states procured capacity, approved projects or passed legislation, and a new coalition was launched to push for at least 10 GW off the California coast by 2040. At year’s end, a Maine utility announced that it was the anchor buyer in a PPA for the first US floating wind power project, a 12 MW facility off the state’s coast.
By the end of 2019, 18 countries (12 in Europe, 5 in Asia and 1 in North America) had offshore wind capacity in operation. The United Kingdom maintained its lead for total capacity (9.9 GW), followed by Germany (7.5 GW), China (6.8 GW), Denmark (1.7 GW) and Belgium (1.6 GW). Europe was home to about 75% of global offshore capacity (down from 79% in 2018), with Asia accounting for nearly all the rest. Additional countries were studying the feasibility of offshore wind or starting project development in 2019, and the World Bank Group announced a new programme to speed the deployment of offshore wind power in emerging markets, many of which have strong offshore wind resources.
Figure 39


Cost reductions in new wind power projects have resulted from a combination of lower capital costs and improved performance.
Offshore and (mostly) onshore, wind turbines of various sizes, totalling an estimated 0.4 GW of capacity in nine countries, were decommissioned in 2019. The United States took the lead, decommissioning about 195 MW of capacity. In Europe, around 170 MW of capacity was decommissioned (down from 451 MW in 2018), led by Germany (97 MW), with turbines also decommissioned in Austria, Denmark, France and the United Kingdom. Some of the decommissioned projects were repowered.
Wind Power Industry
Wind energy has emerged as one of the most economical ways to add new generating capacity. Yet, while falling prices are helping to move wind power into new markets and are pushing up sales, the global transition from FITs to auctions and tenders has resulted in intense price competition in some countries, challenging wind developers and causing attrition among turbine manufacturers. Even as progress is made, new challenges have emerged in some markets, such as poorly designed tenders, permitting delays and lack of available land and grid access, as well as the inherent limitations of power systems and markets that were designed and optimised for centralised, large-scale fossil power.
Meanwhile, the industry is working to meet each new challenge with improved technologies (including larger and more efficient turbines) and other advances (such as supply chain efficiencies) that are helping to further reduce the cost of energy and to better integrate wind energy with existing electricity grids.
By one estimate, from 2018 to 2019 the global benchmark levelised cost of energy (LCOE) from new wind power projects declined 10% onshore (to an average USD 48.5 per MWh) and 28% offshore (USD 83.50 per MWh).162 Cost reductions have resulted from a combination of lower capital costs and improved performance.
Auctioned capacity in 2019 was more than double the 2018 total, with 25 GW auctioned onshore and 15.8 GW offshore in at least 18 countries (including wind-specific and technology-neutral/renewable energy auctions. Auction results vary widely depending on local conditions and costs, project scale, expected commissioning date and other factors.
While declining costs and fierce competition have driven average bid prices down in many markets, bids have been rising in others, such as Germany.
Some of the lowest winning bids (excluding China) in 2019 were seen in Brazil (USD 20.8 per MWh) and Denmark (USD 22.8 per MWh).
Saudi Arabia’s first commercial wind farm, the 400 MW Dumat Al Jandal project, reached financial close in July at USD 19.9 per MWh. In Latin America and the Caribbean, the surge in public auctions helped to drive down the region’s average price for wind energy by 46% from 2016 to 2019. Colombia’s first successful renewable energy auction brought low average winning prices (for both wind and solar energy) of USD 28 per MWh in 2019.
Across Europe, more than 14 GW of new wind power capacity was awarded (about 7.6 GW onshore and 6.8 GW offshore) through auctions in 2019. The region’s largest onshore auction was held in Poland, where 2.2 GW of capacity was awarded at an average price of EUR 49 (USD 55) per MWh. Europe’s winning onshore bids were in the range of EUR 21 to EUR 67.2 (USD 23.5 to USD 75.3) per MWh. However, while average awarded bid prices continued to fall in Denmark and Greece, for example, they increased further in Germany (above the statutory tariffs under the old FIT), where five of the six onshore wind power auctions in 2019 were undersubscribed.
Offshore in Europe, prices in auctions (in France, the Netherlands and the United Kingdom) continued to fall due in part to technology innovations and economies of scale.
The United Kingdom awarded 5.5 GW of capacity offshore in a single auction, for projects to be commissioned between 2023 and 2026, with strike prices 30% below those of the 2017 auction.
The Netherlands held its second offshore wind tender for which the winning project (due online by 2023) will receive only the wholesale price of electricity and will pay an annual rent for seabed rights.
In the United States, while average contract lengths shortened, wind PPA prices remained level or even rose throughout 2019, following historic lows in 2018, in anticipation of the PTC phase-out and further exacerbated by tariffs.
Vestas blamed its rising execution costs and falling margins in the United States (the company’s most important market) on trade conflicts and tariffs, which had cascading effects on the global supply chain.
US tariffs on steel and aluminium, which make up 70-90% of wind turbines, as well as tariffs on permanent magnets, have put pressure on the US network of suppliers. By one estimate, US tariffs on Chinese imports increased the costs of US wind projects by as much as 20%. Several other countries also have introduced new trade barriers on wind-related commodities and components, which affects the flexibility of supply chains, even as local content rules push for localisation of manufacture.
While the shift from FITs to other instruments such as tenders and auctions has helped push down the cost of energy, it also has helped create a race to the bottom on price. This intense competition (combined with trade tariffs in some cases) has challenged the sustainability of the entire supply chain, squeezing the margins of turbine manufacturers, developers and operations and maintenance (O&M) suppliers.
For a variety of reasons, including tender design and unrelenting competitive pressures, the diversity (in size and geography) and the number of auction participants has dropped sharply in some countries, including Germany and India, with only a handful of large international corporations submitting bids.
The wind industry has seen more than 100 turbine suppliers over the years, with a peak of 63 suppliers reporting installations during 2013, but the number has declined rapidly since 2015; in 2019, four companies (three in China and one in India) had no new installations.
While 33 manufacturers delivered wind turbines to the global market during the year, the top 10 companies captured 85.5% of the capacity installed (up from 85% in 2018, 80% in 2017 and 75% in 2016).
The leading four companies – Vestas (Denmark), Siemens Gamesa (Spain), Goldwind (China) and GE Renewable Energy (United States) – were responsible for about 55% of capacity installed during 2019. Vestas stayed on top but lost the most market share; Siemens Gamesa jumped from fourth to second (and led the offshore market); GE benefited from the healthy US market; and Goldwind continued to dominate in China while also increasing its presence in the Asia-Pacific region and beyond.
China-based Envision also remained in the top five globally. Germany’s Nordex-Acciona and Enercon (despite a significant decline in market share) took the seventh and eighth spots, and the remaining companies among thetop 10 (all Chinese – Ming Yang, Windey and Dongfang) moved up in ranking thanks to a strong domestic market.
By contrast, Senvion (Germany) and India’s Suzlon – both of which were among the top 10 in 2017 – suffered severely as a result of declining home markets, as did Enercon, despite remaining among the top 10 (80% of the company’s installations were outside of Germany).
After two years of dramatic decline in the German onshore market, Enercon cut thousands of jobs at home and abroad, ended co-operation with domestic production partners and reported significant losses.
Senvion, once a leading innovator in the global industry, filed for insolvency in 2019; Siemens Gamesa took over some of Senvion’s key European assets and businesses.
In early 2020, Suzlon disclosed outstanding debt of about USD 1.8 billion and started debt restructuring.
Even the top manufacturers suffered losses, closed factories and laid off workers in 2019, despite record turbine orders (globally and for individual companies) and increased revenues, due to rising costs that included trade-related tariffs.
But some companies opened new facilities as well, driven by the need to reduce transport costs and to access new revenue sources, as well as by local content requirements. For example, Vestas opened a new turbine factory in Brazil, and MHI Vestas Offshore Wind (Denmark) signed a contract for blade materials in Chinese Taipei; Nordex opened a rotor blade factory in Mexico; Siemens Gamesa completed Turkey’s first nacelle factory, a condition of Turkey’s first wind tender in 2017, and confirmed plans for a nacelle assembly plant in Chinese Taipei; and GE started constructing a factory in China for its 12 MW Haliade-X.
Many wind turbine manufacturers and project developers were pulling together teams to expand into solar PV, and many were developing hybrid projects during 2019.
In Australia, China, India, the United States and several European countries, wind power projects have been co-located with solar and/or storage projects to reduce energy prices while mitigating the impacts of variability and expanding revenue opportunities.
Some companies have taken this a step further. In 2019, Acciona (Spain) was studying the use on its turbine towers of flexible solar PV thin films made of carbon to power auxiliary systems.
Also during the year, a 2 MW hybrid project in Minnesota was the first in the United States to combine solar and wind power at the same interconnection, using a GE turbine that routes solar and wind energy through a shared inverter.
Pairing technologies not only side-by-side but at the same interconnection reduces costs of equipment, siting, grid connection, financing, and operations and maintenance compared to separate projects, while also increasing capacity factors. The Minnesota project, for example, expects a capacity factor of 65-70%.
Both the number and size of large projects continued to increase in 2019, especially onshore in China and the United States and offshore in the United Kingdom.
By year’s end, the largest projects in operation were the East Anglia (0.7 GW) and Hornsea One (1.2 GW) off the UK coast.
Particularly offshore, the rapid increase in project and turbine size has helped to reduce costs through scale and standardisation – as project size increases, the costs of capital and the per MW costs of planning and balance-of-plant all typically decline.
The world’s largest turbine started generating electricity in November, and serial production was scheduled to begin in 2021.
The trend also continued towards larger machines (including longer blades, larger rotor size and higher hub heights, and therefore higher power rating) for both onshore and offshore use, as turbine manufacturers aimed to boost output and to gain or maintain market share. The average size of wind turbines delivered to market was 12% larger than in 2018 (2.45 MW), at 2.76 MW (2.6 MW onshore and nearing 5.7 MW offshore) in 2019.
Onshore, the largest country averages were seen in Morocco(4.2 MW), Finland (almost 4.2 MW) and Norway (3.8 MW), with averages exceeding 2 MWin all other established markets – including Brazil (2.6 MW),the United States (2.5 MW) and China (nearly 2.4 MW).
Offshore, the highest average power ratings were in Belgium and Portugal (both 8.4 MW), and in Denmark (8.3 MW). Across Europe, the average per unit capacity of newly installed wind turbines offshore in 2019 was 7.2 MW, up from 6.8 MW in 2018.
Wind turbines are set to get only bigger. Siemens Gamesa launched a 10 MW offshore wind turbine in January 2019 and presented an upgraded 11 MW model late in the year; the company plans to have the machine on the market in 2022.
MHI Vestas also had a 10 MW turbine under way in 2019. Chinese manufacturers are in competition to develop machines that match these capacities, and both Dongfang (prototype) and CSIC Haizhuang (plan only) unveiled 10 MW machines in 2019.
GE installed its first Haliade-X (12 MW) prototype at the Port of Rotterdam; the world’s largest turbine to date started generating electricity in November, and serial production was scheduled to begin in 2021. The machines blades are the longest ever made, at 107 metres, about the length of a football pitch (soccer field), and a single turbine is expected to generate enough electricity for 16,000 European homes. Other turbine and generator companies are working on the next generation, envisioning unit capacities of 20 GW.
Offshore wind farm developers are taking advantage of larger wind turbines as soon as they become available, with several orders placed for these mega-turbines during 2019. Larger wind turbines mean that fewer foundations, converters, cables, less labour and other resources are required for the same output, translating into faster project development, reduced risk, lower grid-connection and O&M costs, and overall greater yield.
At the same time, increasing machine size (whether for onshore or offshore use), large projects and developments farther out to sea have required that suppliers adapt designs to minimise the logistical challenges of manufacture, transport, installation as well as O&M. GE, for example, developed a two-part blade that can be assembled on-site for its largest onshore turbine (5.3 MW).
Drones already have been used to inspect blades, reducing outage time from hours to minutes and reducing the required numbers of vessel trips.
In 2019, Vestas unveiled a research partnership to develop drone technology to support blade installation, and Siemens Gamesa, Ørsted (Denmark) and Esvagt (Danish vessels supplier) were exploring how to use drones to transport spare parts to offshore wind projects. Some operators have begun to pool resources at centralised facilities or to expand operations hubs at sea that can house technicians for weeks at a time.
The offshore industry also made advances in the segment of floating wind turbines, which offer the potential to expand the areas where offshore wind energy is viable and economically attractive because they can be placed where winds are strongest and most consistent, rather than where the sea-floor topography is suitable. Several configurations for floating substructures continue to be developed and demonstrated in Europe and elsewhere, and the technology is becoming increasingly cost-competitive.
During 2019, Portugal installed the first platform of WindFloat Atlantic, and the first of three 8.4 MW wind turbines began feeding the grid, while Spain tested the first multi-turbine floating platform. Innogy SE (Germany), Shell (Netherlands) and Steisdal Offshore Technologies (SOT, Denmark) announced the final investment decision to build a demonstration project off Norway using SOT’s modular floating foundation con-cept, which can be fully industrialised and deployed without installation vessels. By year’s end, Europe’s floating fleet reached 45 MW, and an estimated 80.5 MW was operating offshore around the world.
The low centre of mass of vertical-axis wind turbines and their potential for use with a floating platform has revitalised interest in the concept. Several attempts, often unsuccessful, have been made in the past to develop these turbines for offshore use. In 2019 and early 2020, Swedish company SeaTwirl, which is developing a floating vertical-axis turbine, announced that it had secured patents in China, Europe and the United States. In September the firm launched a two-year project with the ultimate aim to commercialise its 1 MW turbine. Vertical-axis designs have the potential to greatly reduce costs by eliminating the need for a number of components, enabling the use of cheaper platforms, improving stability and requiring easier and less costly maintenance compared to horizontal-axis turbines.
In Europe, major offshore wind power developers advanced efforts to produce hydrogen from excess wind energy for greater grid flexibility or for use in transport and industry. In 2019, Ørsted (Denmark), the world’s largest offshore wind developer, announced plans to use electricity from wind farms being built off the Dutch coast to produce hydrogen for sale to industrial customers. Siemens joined a partnership to develop a hybrid solar PV-wind power project in Australia for hydrogen production, and partnered with Shell (Netherlands) and grid operator TenneT (Netherlands/Germany) to propose a joint offshore wind power and hydrogen tender in Germany.
As offshore wind power has advanced, particularly floating technologies, Shell and other major oil companies have become interested in the sector. Developments in 2019 included: Italy’s oil and gas contractor Saipem unveiled a new substructure that can be a foundation for a range of turbine sizes; US-based ExxonMobil was researching the use of floating wind turbines to enhance oil production; and Equinor (Norway), which built the world’s first floating offshore wind project (Hywind Scotland), entered the Chinese offshore market and committed to constructing a project to supply oil and gas facilities by 2022, aiming to reduce costs 40% compared to Hywind Scotland.
New offshore markets still face challenges that Europe and China have addressed, including developing supply chains, a trained workforce and associated infrastructure such as ports, rail links and installation vessels, as well as grid infrastructure and technology for electrical connections. Much of the Asian market also lacks viable finance solutions and co-operation among the relevant countries. However, several countries – including India, Turkey and Vietnam – were collaborating with Denmark in 2019 to develop roadmaps and build technical capacity.
In the United States, states are collaborating to establish an efficient supply chain and are investing in grid infrastructure. US utilities and project developers are partnering with Europe’s largest offshore wind developers to set up manufacturing hubs and build projects, while also working with US government agencies, environmental organisations and the fishing industry to study and address the potential impacts of offshore wind power on fisheries and wildlife.
Around the world, major manufacturers are focused increasingly on the repowering segment.
Around the world, and particularly onshore, major manufacturers are focused increasingly on the repowering segment. Historically, repowering has involved the replacement of old wind turbines with fewer, larger, taller, and more-efficient and reliable machines at the same site, but increasingly operators are switching even relatively new machines for larger and upgraded turbines (including software improvements) or are replacing specific components, such as blades (partial repowering). Such partial repowering can extend turbine lifetime while greatly increasing a wind farm’s performance. Nearly every major turbine manufacturer offers various upgrading services.
In the United States, project owners partially repowered a total of 2.8 GW at existing projects, up from 1.2 GW in 2018. Despite the rising number of ageing turbines in some European countries, repowering was down relative to 2018 due to permitting challenges, lack of regulatory support and high wholesale electricity prices An estimated 185 MW of European capacity was repowered, mostly in Germany but also in Austria, Greece and the United Kingdom. Repowering in China has been limited to date.
As the earliest fleets of wind turbines reach retirement age, concerns are increasing about what to do with turbines at the end of their life. Although most of a turbine can be used on another wind farm or recycled, blades are made of materials that are difficult and expensive to recycle. Developments in 2019 that were aimed at addressing this challenge included a partnership in Europe among wind power and chemical industries to advance recycling efforts for composite wind turbine blades; plans by the Danish company Miljoskarm to grind blades into small pieces and use them in recycled plastic casing as noise barriers; and the construction by US-based Global Fiberglass Solutions of a recycling plant that will break down blades and turn them into water-resistant pellets or panels for use as flooring and walls.255 In addition, US researchers were working to develop blades from a thermoplastic resin system, which has the potential to reduce the energy, time and cost involved in manufacturing while also allowing for blades to be recycled at the end of their life.
Also in 2019, GE Renewable Energy announced that it would make its operations 100% carbon neutral by the end of 2020. Siemens Gamesa committed to becoming a carbon-neutral company by, for example, switching all operations to renewable energy-based electricity sources, and in early 2020 it turned its attention to its international supply chain.
Also in early 2020, Vestas (which achieved 100% renewable electricity in 2013) joined RE100 and set a target to become carbon-neutral by 2030 through its own corporate actions. Vestas also announced plans to eliminate non-recyclable waste from manufacturing, operating and decommissioning of its wind turbines by 2040.
Small-scale Wind Power
Small-scalei (up to 100 kW) wind turbines are used for a variety of on- and off-grid applications, including defence, rural electrification, water pumping and desalination, battery charging, telecommunications and to displace diesel in remote locations. The annual global market continued to shrink in 2018 (latest data available) in response to unfavourable policy changes and ongoing competition from relatively low-cost solar PV.
By one estimate, 47 MW of new small-scale wind power capacity was installed in seven countries during 2018, down from an estimated 114 MW in 2017. China continued to be the largest market, with an estimated nearly 31 MW installed in 2018, a slight increase from 2017 but a substantial decline relative to previous years. The United States deployed an estimated 1.5 MW (2,661 units) in 2018, a 12% annual reduction that continued the country’s downwards trend in small-scale turbines. The UK market also fell further from its 2014 peak, in step with FIT changes.
Japan and Denmark, by contrast, both saw significant increases during 2018. Japan added an estimated 12.9 MW (up from 2.85 MW in 2017) and had another 153 MW in the FIT-approved queue by year’s end. Worldwide, more than 1 million small-scale turbines (totalling at least 1.7 GW) were estimated to be operating at the end of 2018.
In response to shrinking markets in recent years, the number of producers of small-scale wind turbines in China and the United States has declined sharply, with manufacturers relying heavily on export markets, which also are in decline. US-manufactured exports, for example, fell from 5.5 MW (USD 42 million) in 2017 to less than 1 MW (USD 4.6 million) in 2018. The number of small-scale wind turbine manufacturers that reported sales in the United States fell from 31 in 2012 to 8 in 2018, and several manufacturers reported that costs were affected during 2018 by tariffs on materials imported from China.
At least in the United States, however, things were looking up in 2019 with evidence that a 2018 extension of the US investment tax credit for small-scale wind power, combined with public research and development funding, could enable small and distributed wind power technology to turn the corner in the country. In addition, US R&D efforts were under way to make wind power a plug-and-play component in hybrid systems and microgrids, among other options.
Also in 2019, a small-scale turbine made by Hi-VAWT (Chinese Taipei) became the first vertical-axis turbine to achieve certification under the Small Wind Certification Council’s Small Wind Turbine Program.
iSmall-scale wind systems generally are considered to include turbines that produce enough power for a single home, farm or small business (keeping in mind that consumption levels vary considerably across countries). The International Electrotechnical Commission sets a limit at approximately 50 kW, and the World Wind Energy Association and the American Wind Energy Association as well as the US government define “small-scale” as up to 100 kW, which is the range also used in the GSR; however, size varies according to the needs and/or laws of a country or state/province, and there is no globally recognised definition or size limit.
The significant reduction in reported deployment between 2017 and 2018 could be due in part to differences in data availability, from US Department of Energy, Office of Energy Efficiency and Renewable Energy, 2017 Distributed Wind Market Report (Washington, DC: 2018), p. 12, https://www.energy.gov/sites/prod/files/2018/09/f55/2017-DWMR-091918-final.pdf.
ren21.net