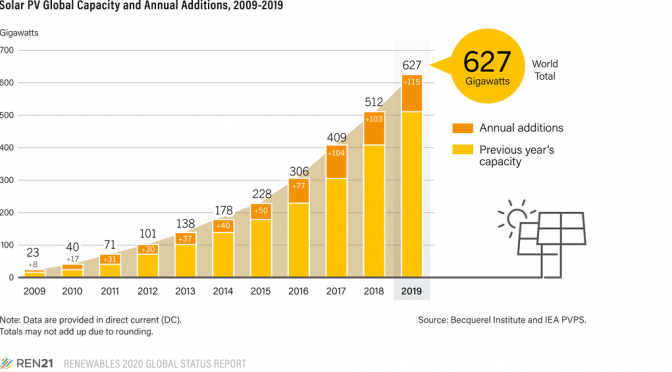
Following a year in which global solar photovoltaics (PV) additions were stable or even contracted slightly, in 2019 the solar PV market increased an estimated 12% to around 115 GWi.1 The decade ended with strong demand in Europe, the United States and emerging markets around the world, more than making up for a substantial decline in China, the single largest market.2 Not including China, the global market for solar PV grew about 44% in 2019.3 The global total of 627 GW, which includes on- and off-grid capacity, compares to a total of less than 23 GW only 10 years earlier.4 (? See Figure 28.)


Demand for solar PV is spreading and expanding as it becomes the most competitive option for electricity generation in a growing number of locations – for residential and commercial applications and increasingly for utility-scale projects – even without accounting for the external costs of fossil fuels.5 In some markets, this is becoming the case for solar-plus-storage as well.6 In 2019, an estimated 18 countries added at least 1 GW of new capacity, up from 11 countries in 2018, and all continents contributed significantly to global growth.7 By the end of 2019, at least 39 countries had a cumulative capacity of 1 GW or more, up from 31 countries one year earlier.8
In several countries, solar PV already plays a significant role in electricity generation.9 By the end of 2019, 22 countries had enough capacity in operation to meet at least 3% of their electricity demand with solar PV, and 12 countries had enough for at least 5%.10 For the full year, solar PV accounted for around 10.7% of total generation in Honduras and substantial shares also in Italy (8.6%), Greece (8.3%), Germany (8.2%), Chile (8.1%), Australia (7.8%) and Japan (7.4%), among others.11 Enough capacity was in operation worldwide by year’s end to produce around 2.8% of global electricity generation.12

There are still challenges to address in order for solar PV to become a major electricity source worldwide, including policy and regulatory instability in many countries, and financial and bankability challenges.13 As the level of penetration rises, solar PV is having an increasing effect on electricity systems, raising the importance of effectively integrating solar energy under varying technical and market conditions in a fair and sustainable manner.14 Opposition from incumbents is generally lower than a decade ago, and many utilities are actively engaging in solar PV deployment and operations, including distributed generation; however, challenges remain in several countries and among some actors, particularly some in the fossil and nuclear industries.15
In most countries, the need still exists for support schemes for solar PV, as well as for adequate regulatory frameworks and policies governing grid connections.16 Government policies – particularly traditional feed-in tariffs (FITs), feed-in premiums and tenders – continued to drive most of the global market in 2019.17 Corporate purchasing of solar PV expanded considerably, and self-consumption was an important driver of the market for new distributed systems in several countries.18 Although still a small share of the annual market, a number of purely competitive (without direct government support) large-scale systems were being constructed in 2019; interest in this segment is significant and growing quickly.19
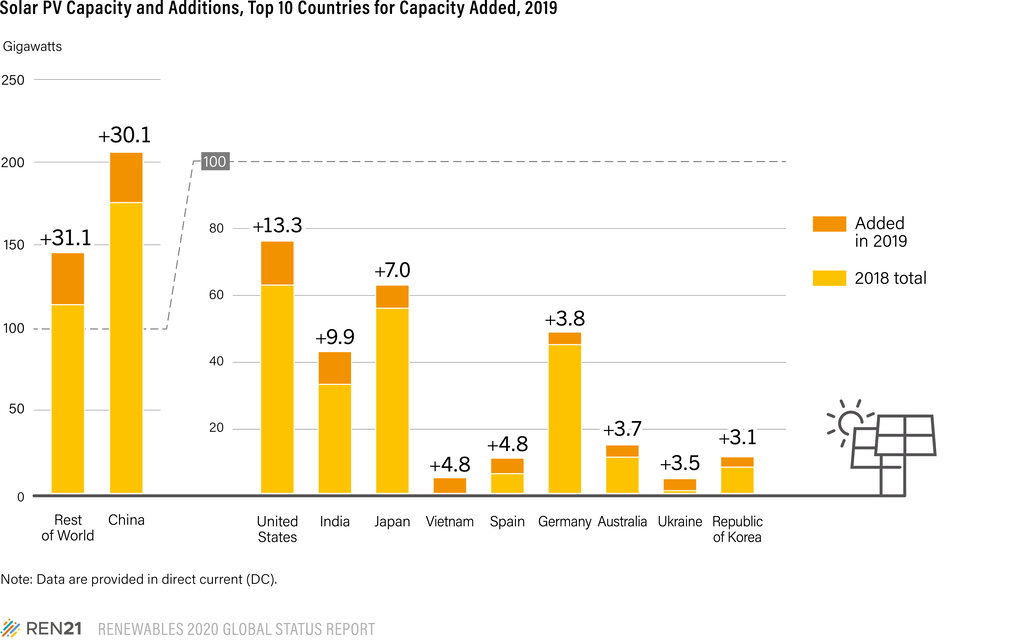
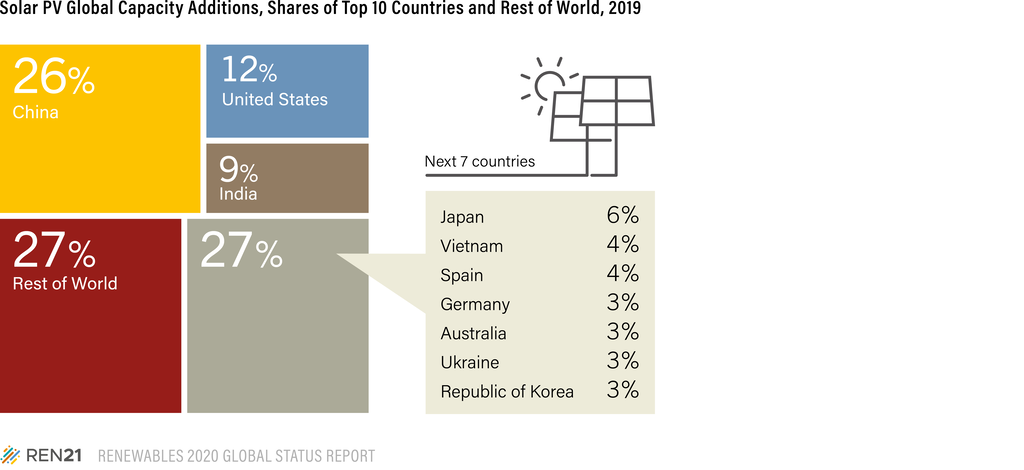
For the seventh consecutive year, Asia eclipsed all other regions for new installations, accounting for half of global additions, despite declines in the region’s top three markets (China, India and Japan).20 Asia was followed by Europe (17%) and the Americas (15%).21 China continued to dominate the global market (and solar PV manufacturing), accounting for around 26% of the year’s capacity additions, but this compares with 44% in 2018.22 The top five national markets – China, the United States, India, Japan and Vietnam – were responsible for around 56% of newly installed capacity, down from around three-quarters in 2018 as the global market becomes less concentrated; the next five markets were Spain, Germany, Australia, Ukraine and the Republic of Korea. 23 The annual market size required to rank among the top 10 countries more than doubled in 2019, reaching 3.1 GWii.24 At year’s end, the leading countries for cumulative solar PV capacity remained China, the United States, Japan, Germany and India, and the leaders for capacity per inhabitant were Germany, Australia and Japan.25 (? See Figure 29.)
Figure 29


Despite China’s year-end rally with more than 12 GW brought online in December alone, the country’s annual solar PV market declined almost 32% (following a 15% drop in 2018), to 30.1 GW newly installed (including 17.9 GW of utility-scale and 12.2 GW of distributediii solar PV).26 Although installations fell for the second consecutive year and were down in almost every region of China, 12 provinces added more than 1 GW each and the country’s total additions were more than double those of the next largest national market, the United States.27 (? See Figure 3. and Reference Table R16.) The leading provincial installer in 2019 was Guizhou (3.4 GW), one of China’s poorest provinces, followed by Shandong (2.6 GW) and Hebei (2.4 GW).28 By year’s end, China’s cumulative grid-connected capacity of around 204.7 GW was almost twice the national solar PV target (105 GW by 2020) that was established in 2016.29
Figure 30

 rce: See endnote 27 for this section.
China’s market decline in 2019 was due largely to policy uncertainty. The country is in the process of restructuring its renewable energy market – shifting from high-speed capacity growth and dependence on direct financial support through uncapped FITs, to deployment of high-quality technologies and systems through auctions and subsidy-free deployment to reduce costs and improve overall performance.30 The national government ceased approvals for new subsidised projects at the end of May 2018, and took more than a year to provide clarity on a revised FIT policy.31 Multiple delays in publication of policy implementation rules pushed back completion dates for several large solar PV projects.32 The market also was tempered by ongoing delays in FIT payments for existing facilities; challenges related to grid connections, land availability and access to finance; an increase in module exports, which curbed expected domestic price reductions and left developers waiting for prices to come more in line with their bids; and more positive and clear guidance for wind power projects, which led some developers to prioritise wind deployment.33
Countries that ranked among the top 10 fornew solar PV installations added
3.1GW
or more.
As part of China’s transition to a market without direct policy support by 2021, a bidding scheme was launched to select solar PV projects for FIT support as well as those for “grid-parity“iv, and by July the government approved 22.8 GW and 14.8 GW of capacity respectively.34 For a variety of reasons, however, less than 10 GW of FIT-supported projects were executed and only about 2 GW of grid-parity projects became operational during the year.35
China’s market for large ground-mounted systems declined around 23% in 2019, and distributed installations (which include residential) were down 41%, but annual installations of residential systems (at 4.2 GW) increased 74% relative to 2018 and exceeded the official full-year target of 3.5 GW.36 Centralised utility power plants (>20 MW) accounted for more than 59% of annual grid-connected installations (and 69% of the year-end total), with distributed systems making up the remainder.37
Curtailment of solar energy in China continued to fall, down1 percentage point from 2018 to average 2% (or a total of 4.6 TWh) for the year.38 Most curtailment (87%) occurred in the north-west region, and the curtailment rate was highest in Tibet (24.1%, down 19.5 percentage points), but it declined in every province except Qinghai, which saw a large increase in renewable power capacity and a decline in load.39 Reduced curtailment and rising capacity helped increase China’s solar PV output from grid-connected systems more than 26% relative to 2018, to 224 TWh.40 As a result, solar PV’s share of total electricity generation (from grid-connected sources) in the country rose to 3% in 2019 (2.6% in 2018).41
The second largest market in Asia and the third largest globally was India, which added an estimated 9.9 GW in 2019 for a total of 42.8 GW.42 India targets 100 GW of installed solar PV, including 40 GW of rooftop solar capacity, by the end of 2022.43
India’s annual installations were down in 2019, following significant growth in 2018.44 Reasons for the decline were many: India’s economic slowdown, tariff caps and higher costs associated with tender participation, payment delays, renegotiation of power purchase agreements (PPAs) in Andhra Pradesh, challenges related to land acquisition, lack of transmission infrastructure and of access to grid connections, liquidity issues and lack of financing (due in many cases to delays in tariff adoption).45 Curtailment also acted as a deterrent to new installations, and the severity was worsened by a decline in power demand due to the slowing economy.46 In August, the national government called for “must run” status for solar and wind power projects, but lacked the ability to strictly enforce the rules.47 Even so, generation from solar power for the year was up 27% relative to 2018.48
Large-scale projects accounted for more than 85% of India’s newly installed capacity and represented the vast majority of total solar PV operating capacity.49 Around 35 GW of tenders was announced in India during 2019, down 8% relative to 2018, with more than 15.8 GW of projects auctioned (up 2%).50 But several tenders were undersubscribed and, as in 2018, many auctions were cancelled retroactively.51 Nonetheless, by the end of 2019 nearly 24 GW of large-scale capacity was reportedly in the pipeline.52

India’s rooftop market declined in 2019 for the first time in five years.53 The contraction was due largely to the economic slowdown combined with liquidity issues, as well as challenges to net metering and lengthy approval processes in some states.54 An estimated 1.1 GW of distributed and off-grid capacity was installed during the year.55 The rooftop market continued to consist mainly of large commercial and industrial companies (which together account for more than 70% of total capacity), as well as government entities (including Indian Railways) and educational institutions, all seeking to reduce their electricity bills; comparatively few residential customers can afford the upfront costs.56
In 2019, 26 countries in the EU-28
added more capacity
than they installed in 2018.
The market in Japan also contracted, for the fourth consecutive year, and was down significantly from the peak year (2015).57 Japan’s market continued to suffer from grid constraints, lack of available land and of low-cost financial resources, high prices of solar generation (Japan’s prices are some of the world’s highest) and high labour costs.58 Even so, Japan progressed towards the national target of 82 GW by 2030: around 7 GW was added during 2019, for a total of 63 GW.59 For the year, solar PV accounted for an estimated 7.4% of Japan’s total electricity generation, up from 6.5% in 2018.60
By late 2019, 530,000 residential solar PV systems in Japan, totalling some 2 GW of capacity, reached the end of their 10-year contract period and exited the country’s FIT scheme; as a result, and to increase resilience of supply, many system owners increased their focus on self-consumption and on achieving net-zero energy use by combining solar PV with energy storage.61 Power companies, home builders and others introduced new programmes for post-FIT residential systems, offering to purchase surplus solar electricity and renewable energy credits for their own use or resale to achieve corporate renewable energy targets.62
In contrast to other large markets in Asia, Vietnam saw a surge in installations as developers rushed to win attractive FIT rates before they expired mid-year, rocketing the country to fifth place globally for additions.63 More than 8.9 GW of large projects had been approved by year’s end, including around 4.5 GW of capacity that came online at the end of June.64 During all of 2019, an estimated 4.8 GW was added (up from 106 MW in 2018 and 8 MW in 2017) for a total of 4.9 GW.65 Vietnam’s interest in solar PV is largely to meet rising electricity demand, which has grown an average of 10% annually in recent years due to population growth and economic expansion.66 Post-June, increasing concerns about grid congestion in the sunniest regions led the government to incentivise new projects in provinces with lower solar resources; in December, the national government urged a suspension of authorisations for all new solar facilities until further notice.67
Other Asian countries that added substantial capacity in 2019 included the Republic of Korea, which installed an estimated 3.1 GW for a total of 11.2 GW, followed by Chinese Taipei, Pakistan, Turkey, Malaysia (approaching 0.6 GW) and Kazakhstan (0.5 GW).68 Chinese Taipei (added 1.4 GW) aims for 20 GW by 2025, but faces several challenges including policy uncertainty, a struggling manufacturing sector and difficulties securing needed land.69 Pakistan had another strong year, adding 1.3 GW for a total of 3.4 GW.70
Turkey’s annual installations declined significantly for the second consecutive year, due to an economic downturn, lack of available financing and other challenges; the country installed 0.9 GW for a total of 8 GW.71 In its first attempt to support small-scale systems, Turkey introduced net metering in 2019.72 Numerous additional countries in Asia brought projects online or held tenders during the year, including Cambodia, which held its first solar PV tender.73

Europe moved ahead of the Americas to rank second for additions (nearly 20.4 GW), and maintained its second-place regional ranking for total operating capacity.74 Demand rose significantly in the EU and beyond: Ukraine, for example, installed a record 3.5 GW (surpassing 1 GW for the first time), thanks to a generous FIT and a scheduled reduction, to place third in all of Europe and ninth globally, while the Russian Federation brought online its largest solar PV plant (75 MW) to date, part of a pipeline of projects allocated in a 2016 auction.75
The EU-28v added around 16 GW of grid-connected solar PV, nearly double the 8.2 GW installed in 2018, bringing total capacity close to 131.7 GW.76 Most markets in the region have moved beyond FITs and were driven in 2019 by the competitiveness of solar generation – which is increasing interest in self-consumption (particularly combined with digital technologies and storage) and in corporate renewable power sourcing (including via direct bilateral PPAs) – as well as by governments looking to meet national renewable energy targets through tenders.77 At the same time, new challenges are emerging, including access to grid connections, land availability and planning permission (particularly in some areas that already have a large installed base), and a shortening of PPA time periods with the shift towards merchant dealsvi.78
In 2019, 26 of 28 countries in the EU added more capacity than they installed in 2018; even so, around three-fourths of new capacity came online in only five countries.79 Spain (4.8 GW) was the top installer for the first time in 11 years, followed by Germany (3.8 GW), the Netherlands (2.4 GW), France (0.9 GW) and Poland (0.8 MW).80 The Netherlands’ installations were up an estimated 66%, led by the country’s rooftop market, and Poland saw its installations quadruple in response to rising incentives for rooftop systems and the extension of net metering.81 For cumulative capacity, Bulgaria, Denmark and Hungary each exceeded1 GW for the first time in 2019.82 The leaders Germany and Italy together were home to more than half of the EU’s cumulative capacity at year’s end, but their shares are declining as markets expand elsewhere.83
Spain added nearly 4.8 GW in 2019, up from less than 0.3 GW in 2018, for a total exceeding 9.9 GW.84 The high level of installations was due mostly to the commissioning of projects tendered in 2017 to meet the country’s EU obligations, as well as to Spain’s first PPA- and wholesale-based plants, and rooftop installations for self-consumption.85 Installation of rooftop systems picked up considerably following the elimination of Spain’s “Sun Tax” in November 2018 and the streamlining of the permitting process.86 By year’s end, grid constraints were the primary barriers to large-scale project implementation.87 In response to an influx of applications for grid connection that far exceed Spain’s expected demand growth, the government tightened grid connection rules as of 2020.88
Annual demand in Germany was up almost 33% relative to 2018, with more than 3.8 GW added in 2019 for a total exceeding 49 GW.89 The market was driven primarily by self-consumption and FIT premiums; limited volume tenders for large (>750 kW) ground-mounted systems accounted for less than 20% of added capacity.90 The number of prosumersvii in Germany increased by almost 100,000 between February 2019 and January 2020.91 An estimated one of every two rooftop installations was sold with a battery storage system.92 In late 2019, the German government announced a new goal of 98 GW of solar PV by 2030, and removal of the 52 GW feed-in tariff cap was under discussion.93 Solar PV generated an estimated 8.2% of Germany’s electricity during the year.94
The United Kingdom’s FIT, a key policy for supporting rooftop solar, closed to new applicants at the end of March 2019.95 In response, new residential installations fell 94% in May.96 Paralysis caused by uncertainty over Brexit as well as policy changes also resulted in reduced investment in community solar projects.97 The country had its slowest year since at least 2010, with an estimated 0.3 GW added, well below the 2015 peak (4.2 GW), bringing total capacity to 13.4 GW.98 By year’s end, however, the pipeline of large-scale projects was reportedly more than 6 GW.99
Across Europe, the number of direct bilateral PPAs continued to climb, and solar PPAs are becoming increasingly competitive with wholesale power markets in some countries.100 Europe’s largest PPA was signed in 2019 for a 708 MW solar PV project portfolio in Spain and Portugal.101 The year also saw the region’s first large-scale PPA for a crowdfunded project; this financing approach represents one of the many innovations taking place in Europe, the United States and elsewhere to aggregate risk and enable the spread of PPAs beyond utilities and large energy-consuming corporations to smaller offtakers and to new countries.102 By early 2020, around 8.4 GW of solar PV capacity was operating or planned under PPAs in Europe, with the largest portion in Spain (4.4 GW), followed by Italy (1.9 GW) and Germany (over 1 GW).103
The Americas represented around 15% of the global market in 2019, due largely to the United States, which ranked second globally for both new installations and cumulative capacity.104 (? See Figure 31.) The country added 13.3 GW for a total exceeding 76 GW.105 Solar PV accounted for nearly 40% of all new US power capacity additions in 2019, the largest share to date.106 California again led all states in added capacity (3.1 GW), followed by Texas (1.4 GW) and Florida (1.4 GW).107 Hawaii led in the adoption of rooftop solar per capita, followed by California and Arizona.108 Utility-scale solar PV generated 69 TWh, or 1.7% of US utility-scale generation in 2019; small-scale systems generated an additional estimated 35 TWh.109
Figure 31

The US market as a whole grew 23% in 2019.110 It was led by the utility-scale sector, which expanded 37%, to 8.4 GW, and accounted for 63% of US additions.111 Non-residentialviii installations declined for the second consecutive year (down 7%), due to policy changes and interconnection delays in some key states.112 But the residential sector had a record year, up 15% to 2.8 GW, driven by ever more attractive economics in many emerging states, as well as by power shutoffs (associated with wild fires) and new-build homes in California.113 California achieved a target of 1 million solar roofs in late 2019, and the state’s mandate to install solar on most new homes entered into force at the start of 2020.114 Also towards the end of 2019, the National Community Solar Partnership was relaunched with the aim of expanding affordable access to solar energy for all US households by 2025.115

The US rush to complete projects, large and small, and to contract for new ones during 2019 was driven in part by impending cuts in the federal investment tax credit (ITC)ix.116 Project developers and small commercial installers stockpiled modules and other equipment to take advantage of the 30% ITC, and installers were at capacity during the second half of the year.117 Falling technology costs and rising renewable energy commitments also drove demand, including in the US Midwest, which historically has favoured wind energy.118 A record high of new solar PPAs (30.6 GW) was signed or announced, bringing the cumulative contracted project pipeline to 48.1 GW.119 Voluntary purchasing accounted for 57% of new procurement in 2019, with an estimated 14% driven by state renewable portfolio standards.120 Innovations such as aggregationx continued to open the market for smaller businesses as well as large corporations.121
Rapidly falling costs of solar PV and battery installations have led to a surge in solar PV-plus-storage projects across the United States by enabling them to begin competing with natural gas-fired generation.122 In 2019, the number of US solar-plus-storage projects announced or already online increased from 16 to 38, and in California most new utility-scale solar was being proposed with some storage capacity.123 Interest in solar-plus-storage is rising in the residential market as well, particularly in Hawaii and in California, where consumers seek energy resiliency and reliability.124 (? See Systems Integration chapter.)
To the south, several countries in Latin America and the Caribbean continued their rapid expansion, despite challenging economic conditions in some countries, thanks largely to an abundance of solar resources, falling prices and favourable political climates until 2019.125 The region’s top installers were Brazil (adding 2 GW), Mexico (nearly 2 GW) and Argentina (0.5 GW).126 Several other countries brought online significant capacity, including Colombia, which commissioned a 86 MW plant, and Jamaica, which completed the Caribbean’s largest solar PV facility (51 MW) – the plant is expected to provide the island’s lowest-cost electricity.127 Numerous countries called for public bids for future solar PV projects.128
Brazil added more than 2 GW in 2019 and ended the year with nearly 4.5 GW.129 An estimated 650 MW of large-scale capacity was brought online, including the first solar PV plant in Latin America to be built with a digital sub-station.130 By year’s end, around 5.7 GW of additional permitted solar PV projects was in advanced stages of development, and there was a growing interest in new opportunities for bilateral PPAs.131 Several large-scale projects reached record-setting low bid prices in government auctions, with plans to sell at least 30% of their electricity into the wholesale market.132 Brazil’s distributed solar PV segment (defined as <5 MW) saw the most growth during 2019 in terms of capacity added (1.4 GW), investments and jobs, driven by net metering and rising energy prices.133 The segment was led by residential systems but saw growing shares of commercial and rural systems.134 An end-of-year push to install distributed systems resulted from proposed policy changes, including a debate under way regarding revisions to the national net metering mechanism.135
Innovations
such as crowdfundingand aggregation are opening PPA markets to more participants.
Mexico continued to lead the region for its cumulative capacity, which rose an estimated 62% compared with 2018 to more than 5 GW.136 Several large plants came online, including a 220 MW facility that will sell electricity into the wholesale market.137 The country also completed what was reportedly the first large-scale project in Latin America to combine solar PV and battery storage.138 However, the Mexican government cancelled all plans for renewable energy auctions, raising concerns about the impact on solar PV deployment after 2020.139 Mexico also had substantial rooftop capacity, totalling 818 MW at the end of 2019.140
Across the Pacific, Australia saw record additions in the small, medium and large-scale segments, and ranked eighth globally for installations.141 Around 3.7 GW was added during 2019, increasing the country’s total capacity to 14.7 GW.142 Although output from solar PV was affected by haze and fallout from the bushfires across much of the country, generation rose 55% in 2019, to 18.1 TWh, or 7.8% of Australia’s total.143 Deployment has been driven by several factors, including falling system prices, increasing awareness of the benefits of solar PV to businesses and households, and the corporate market for PPAs.144
Corporate solar PPAs continued to be announced in Australia, although at a slower pace than in 2018, with solar PV accounting for 82% of the 400 MW that was newly contracted in 2019.145 An important innovation in Australia during the year was the development of retail PPAs, in which buyers (particularly a growing number of mid-scale buyers) contract for power via a retailer.146 Among the new smaller agreements was a seven-year PPA signed by the Sydney Opera House for solar and wind power projects and a residential solar PPA for home buyers in a Western Australia housing development.147 The number of merchant projects (selling on the spot market) rose as well.148
Australia’s capacity in large-scale (>5 MW) solar PV projects saw record increases.149 Yet small-scale (<100 kW) household and commercial rooftop solar PV continued to be the largest sector in Australia by far, as both the number and average size of new systems continued to rise.150 Annual installations increased 35% over 2018, to nearly 2.2 GW added (287,504 new systems), for a year-end total approaching 10.4 GW (2.3 million systems).151 During the year, small-scale systems powered the equivalent of more than 2.6 million households, accounting for 5.3% of the country’s total electricity generation.152 In addition, 22,000 small-scale batteries were installed in 2019, bringing Australia’s household storage capacity to more than 1 GWh.153
Rapid growth in solar (and wind) generation is transforming Australia’s electricity landscape, reducing electricity prices and air emissions while pushing out coal-fired power plants (which are increasingly unreliable and expensive to operate).154 The vast scale of installations in 2018 and 2019 – well beyond expectations – resulted in an overcrowded grid and connection delays as transmission investment failed to keep up with the growth in renewable energy.155 By mid-year, grid connections for large projects were increasingly time-consuming and costly (reducing revenue for projects once they were online); this challenge – combined with a lack of clarity about state and federal policies and targets, and the increase in regulatory risks as well as curtailment – led to delayed and cancelled projects, and raised barriers to investment. 156 The rooftop sector also has experienced problems related to the ability of distribution networks to integrate high penetration rates of solar energy with battery technology.157
The Australian Energy Market Operator (AEMO) responded by starting to upgrade grids in key regions and by creating renewable energy zones.158 AEMO also is working on an integrated roadmap for efficient development of the country’s national electricity market over the coming decades.159 By early 2020, frustration over grid congestion led Victoria to break away from national electricity rules to fast-track transmission upgrades and ensure grid-connection for large projects.160
The Middle East and Africa also saw substantial solar PV installations in 2019. An estimated 6.7 GW was added for a year-end total of 15.1 GW, an 80% increase in cumulative capacity across these two regions.161 As in 2018, the largest installer in the Middle East was the United Arab Emirates, which aims to achieve 50% renewable energy by 2050.162 Commercial operations began at the 1,177 MW Sweihan facility in Abu Dhabi, the world’s largest single-site solar project at the time of completion, expected to cover the electricity requirements of 90,000 people.163 In addition, Dubai allocated the fifth phase (0.9 GW) of its 5 GW Mohammed bin Rashid Al Maktoum Solar Park.164 At year’s end, the United Arab Emirates had more than 1.7 GW of solar PV in operation, including at least 125 MW of rooftop capacity under Dubai’s Shams initiative.165
Other noteworthy installers in the Middle East included Saudi Arabia, where production began at the country’s first grid-connected solar PV plant (0.3 GW Sakaka) in late 2019; Jordan (added 0.6 GW), where at least two large plants were completed and efforts continued towards the goal to install solar PV on all of the nation’s 7,000 mosques; and Israel, which completed its largest solar PV park (120 MW) and added a total of 0.8 GW.166 Kuwait and Oman added large projects to their pipelines, and Iraq launched a tender for 755 MW of capacity.167 Policy makers in several countries – including Jordan, Oman, Saudi Arabia and the United Arab Emirates – have reduced electricity tariffs and are starting to prioritise distributed solar PV, particularly in Dubai, but many countries are still struggling to find the right mix of policy, financing and procurement options.168

Across Africa, as costs fall, solar PV is viewed increasingly as a means to diversify the energy mix, to meet rising demand while limiting the growth of CO2 emissions and to provide energy access.169 But considerable challenges remain, including a lack of suitable financing tools, ongoing subsidies to fossil fuels in many countries as well as social and political unrest in some, a reliance on tenders for new capacity and a race to the bottom in bid prices.170 Even so, several countries brought projects online during 2019, including the first large plants in Kenya (50 MW), Mozambique (40 MW), Namibia (45 MW) and Zambia (54 MW), among many others.171 The largest solar PV plant in all of Africa, Egypt’s Benban solar complex, became fully operational in late 2019; the facility, covering more than 37 square kilometres of desert and with a capacity of nearly 1.5 GW, is expected to provide electricity to 1 million people.172 At the other end of the spectrum of scale, several countries saw numerous rooftop and other small-scale systems come into operation during the year. South Africa, for example, had more than 100 MW of rooftop systems by the end of 2019.173 (? See Distributed Renewables chapter for more on access and small-scale solar PV.)
Many other countries on the African continent held solar PV tenders or had large plants being planned, under construction or commissioned, including Morocco, which had several solar PV-concentrating solar thermal power (CSP) complexes under way.174 Also in 2019, a plan was unveiled to dramatically expand solar PV (and CSP) capacity in Botswana and Namibia to reduce reliance on energy imports and enable the export of surplus electricity to surrounding countries.175 Regional efforts also were under way to expand the use of solar PV across the continent.176 At year’s end, Africa’s top countries for cumulative solar PV capacity were South Africa with 3.4 GW (added 1 GW), Egypt with nearly 2.3 GW (added 1.65 GW), Algeria with 0.5 GW (no additions) and Kenya (added 0.2 GW for a total of 0.3 GW).177
Around the world, even as favourable economics are raising interest in distributedxi systems, especially for commercial and industrial uses (as well as off-grid), large utility-scale projects continued to dominate the global market for newly installed capacity.178 (Even the size of distributed systems is trending larger in many countries.179) The move towards ground-mounted large-scale systems is due at least in part to the growing use of tenders and auctions, and increasingly also to PPAs, whether in Europe, Australia or new markets such as Vietnam.180
Solar PV plants are approaching the scale of fossil-fired power plants as developers aim to drive down the price of solar electricity.181 The size and number of large projects continued to grow during 2019, with more than 50 solar PV plants of 50 MW and larger completed, and such plants were operating in at least 44 countriesxii by year’s end.182 Developers commissioned at least 35 projects that were 200 MW or larger.183 In addition to those mentioned previously, new facilities included a 420 MW solar complex in Vietnam; Spain’s 494 MW Mula plant (reportedly Europe’s largest solar PV project at year’s end); China’s largest (500 MW) project without direct financial support (which will compete against coal- and natural gas-fired plants); and India’s 2 GW Pavagada Solar Park, which began development in 2016 and was completed in 2019.184
Operating capacities of many new
solar PV
plants are approaching the level of fossil-fired power plants as developers aim to drive down the price of solar electricity.
Large-scale ground-mounted plants can cover vast areas, raising concerns about potential environmental impacts, grid-connection challenges and the use of agricultural lands.185 The potential for rooftop solar systems remains enormous, and many countries, such as India, have established large rooftop programmes and targets.186 The relatively small market for floating solar also continues its rapid expansion, driven by the limited availability and high costs of land in many places.187 Floating projects bring new risks and generally higher costs than ground-mounted facilities, but economies of scale in project sizes are helping to reduce associated costs.188 (? See Sidebar 3 in GSR 2019.)
Most floating solar PV projects are sited in Asia, but they can be found from Africa to Europe to the Americas.189 During 2019, China completed several large plants, including a 70 MW project at a former coal mining area in Anhui Province; India held a tender for a floating solar PV project (70 MW); Portugal held a tender to seek engineering, procurement and construction contractors for 10 floating solar PV plants (50 MW total) and, in early 2020, Vietnam announced pilot auctions for an eventual 400 MW.190 Floating projects also are being constructed offshore, with a pilot project completed off the Dutch coast in the North Sea, and plans were announced for projects off the coasts of the United Arab Emirates, the Republic of Korea and Singapore.191 A total floating capacity of at least 2.4 GW was expected to be operating in 35 countries by year’s end, with projects completed or under way in almost every region.192

Other niche markets that minimise land requirements include building-integrated PV, which is progressing only slowly (a highlight in 2019 being a new high-rise building in China with a 460 kW façade), and the emergence of plans among mainstream auto manufacturers, particularly in Asia, to incorporate solar cells into electric vehicles.193 Agricultural PVxiii also is an emerging sector that can address concerns associated with land use, especially with the growing availability of bifacial systems (see later discussion).194 Several studies have highlighted the advantages, including improved crop yields, reduced evaporation, rainwater harvesting (with modules), provision of shade for livestock and prevention of wind and soil erosion, as well as additional income for farmers from electricity production.195 In 2019, a total of more than 2.9 GW of capacity was operating in Japan and elsewhere, and plans were announced for new projects, including a 1 GW agricultural PV livestock farming project in Malaysia.196
Solar PV Industry
The year reflected a dichotomy of perspectives on the health and prosperity of the solar PV industry. On the one hand, competition drove declining prices, which in turn opened new markets, while the pressure of lower prices and expectations of rising global demand encouraged expanded and more efficient manufacturing, the entrance of new companies into the sector and ongoing pursuit of innovation. On the other hand, the relentless competition, coupled with policy vagaries and uncertainty, prompted highly competitive bids at some auctions – resulting in razor-thin margins for some developers and manufacturers – and contributed to ongoing consolidation.

Globally, solar PV prices continued to decline in 2019.197 The price of modules fell around 12% during the year, to a world average of USD 0.36 per watt, but with significant variations in price from country to country.198 A ramp-up in manufacturing along the supply chain in recent years, due to overly optimistic expectations about global demand growth (particularly in China), held down prices for polysilicon, wafers, cells and modules.199 Innovations and improvements in design and operation also helped to reduce operations and maintenance (O&M) costs.200 By one estimate, the global benchmark levelised cost of electricity (LCOE) from solar PV declined 17% relative to 2018.201
Tenders and auctions saw bid pricesxiv drop to new lows in 2019, and in some countries they fell below the average price of wholesale electricity.202 The average bid price across all markets was close to USD 30 per MWh, but bids below USD 20 per MWh became more common towards year’s end.203
The lowest bid prices were seen in Brazil, Dubai (United Arab Emirates) and Portugal. In Brazil’s A-6 auction, solar PV came in with the most competitive final average electricity price among all competing technologies (including wind power and natural gas) at BRL 67.48 (USD 16.48) per MWh.204 Dubai allocated 0.9 GW of capacity at a price of USD 16.95 per MWh, and Portugal awarded 1.29 GW with a world-record low bid of EUR 14.76 (USD 16.53) per MWh.205
Time will tell if the lowest bids will be viable. Outside of locations with a low cost of finance, open desert and excellent solar resources, such as Dubai, a broad range of experts believe that very low bids, such as Portugal’s winning price, are possible only because firms made overly optimistic assumptions about future cost reductions (ahead of project construction) or plan for merchant sales at the end of the contract period, betting on the merchant price (until the end of project lifetime) to supplement revenues.206 Several record-setting low bid prices in Brazil’s auctions were made by developers planning to sell at least some of their electricity into the wholesale market.207
Direct bilateral PPA prices also reached new lows in 2019 and in early 2020.208 In the United States, PPA prices were in the range of USD 16 to USD 35 per MWh, and solar PV-plus-storage achieved a new record low in the country of USD 40 per MWh for the Eland projectxv in California’s Mojave Desert, which should be operational by 2023.209 In January 2020, a PPA was signed in Qatar for800 MW at QAR 57.1 (USD 15.8) per MWh, one of the lowest prices ever recorded.210 Agreement periods are shortening in Australia, Germany, the United States and elsewhere, with price trajectories flattening (at least in Australia and the United States), and several markets have begun shifting towards the merchant model.211
New lows in auction prices, resulting from intense competition (with some instances of bidding below marginal costs to win tenders) – in some cases driven by policy design – constrained margins and brought further consolidation in the industry.212 Among the casualties in 2019: China-based module manufacturer Hareon Solar was forced into bankruptcy liquidation; Suntech (China), once the leading global manufacturer, again came up for sale or liquidation; another former world leader, Yingli (China), continued to lose money, following several difficult years; Panasonic (Japan) transferred a solar module manufacturing subsidiary in Malaysia to GS-Solar (China), as part of an effort to return its solar business to profitability; Moser Baer Solar (India) began liquidating its assets; and several solar-related companies in Chinese Taipei consolidated to survive through economies of scale.213
By contrast, many Chinese cell and module manufacturers benefited from record-low prices for polysilicon, solar wafers and cells, as well as from strong demand from most regions around the world.214 LONGi, for example, saw both its revenues and net profit rise in 2019, with further improvements in the first quarter of 2020.215 LONGi and other top-tier vertically integrated companies were able to cope with price declines by expanding production to take advantage of lower costs of new equipment and economies of scale, in some cases through joint partnerships.216 For example, LONGi and Tongwei signed a strategic co-operation agreement to support each other’s supply chains, following on earlier joint ventures and agreements; and GCL-Poly and Zhonghuan Semiconductor announced a plan to further their co-operation by increasing joint manufacturing capacity.217
Many companies achieved or announced significant increases in production capacity in 2019, reflecting optimism about future market growth, efforts to maintain market share, as well as policies to promote local manufacturing.218 By the end of 2019, global crystalline and thin-film cell production and module assembly capacitiesxvi were estimated to be 153.1 GW (cell) and 185 GW (module), respectively, up 35% and 29% over 2018.219
Much of the expansion occurred in China.220 China has dominated production and global shipments of solar PV cells and modules since 2011, which means the country also has dominated the prices of cells and modules, influencing the margins that other manufacturers receive.221 This continued to be the case in 2019. During the year, 123.5 GW of cells and modules were shipped worldwide (up 39% over 2018), mostly from manufacturers in Asia, and particularly China.222 Of the estimated 78 GW of cell/module volume shipped by the top 10 suppliers, over 80% was shipped by Chinese firms, with the others representing equal shares of the remaining volume and hailing from the Republic of Korea (Hanwha Q-Cells), Chinese Taipei (UREC) and the United States (First Solar).223
The solar PV industry
remained vulnerable
to turbulence in some countries, and particularly in China.
The solar PV industry remained vulnerable to turbulence in some countries (the list of countries changing annually), and particularly in China.224 In China and elsewhere, policy uncertainty as well as policies that are stop-go or poorly designed – including cancelled or postponed auctions – hampered the industry.225 The industry also was challenged by unreliable or insufficient grid infrastructure (often the reason for revisions to policies and targets), particularly in emerging markets.226
Trade policies also continued to affect the solar PV industry in 2019.227 (? See Sidebar 3 in Policy Landscape chapter.) India imposed new duties on product imports from several other Asian countries and from Saudi Arabia as part of the push towards domestic manufacturing.228 US tariffs imposed in 2018 on nearly all major sources of solar PV imports, as well as on steel and aluminiumxvii, were in place throughout 2019.229 The United States added tariffs on Chinese solar inverters, and removed India from duty-free status for many products, including solar cells and modules.230 In addition to tariffs on imports, several countries had measures in place to encourage local production or to penalise the use of foreign-made products.231
During the year, the US International Trade Commission found that US tariffs had boosted module manufacturing in the country – including new module plants set up by Hanwha Q-Cells and LG (both Republic of Korea), and by China’s Jinko Solar – but had failed to halt the decline of domestic cell makers.232 The Commission also found that tariffs had softened solar price declines in the United States compared to those experienced globally.233 Bifacial panels were granted exemption from US import tariffs in June (with a temporary reversal in Octoberxviii), and US demand for bifacial panels soared in an effort to evade tariffs and improve project efficiency, as well as to stockpile modules to qualify for the 30% federal investment tax creditxix.234
In spite of the challenges faced by some actors in the solar PV industry, new companies continued to enter in.235 For example, most of the largest wind power developers in the United States have expanded into solar PV and energy storage, and similar trends are seen in China, India and elsewhere.236 Oil and gas giants, particularly Europe-based companies, are moving into solar project development and operation, and using solar PV to power their operations around the world.237
Competition
and price pressures have encouraged investment in solar PV technologies, particularly in cells and modules.
In addition to driving the construction of new, more-efficient manufacturing facilities, competition and price pressures have encouraged investment in solar PV technologies across the entire value chain, and particularly in solar cells and modules, to further improve efficiencies and reduce the LCOE.238 New record cell and module efficiencies were achieved during 2019.239 Monocrystallinexx cell technology, which lost its lead to multicrystalline in 2002, raced ahead for the majority share of global shipments.240
Demand for higher-efficiency modules has steered a shift towards Passivated Emitter Rear Cell (PERC)xxi technology and the next generation of technologies.241 PERC has become the new standard for the monocrystalline silicon solar cell variety because it increases efficiencies, making it an economically attractive option for many projects.242 Manufacturers of PERC (particularly China’s LONGi) have invested heavily in its commercialisation.243
While monocrystalline PERC is the focus of most capacity expansions, and substantial commercial capacity came online in 2019, the industry is already looking beyond PERC.244 In 2019, several manufacturers were converting or building new factories to produce heterojunction cell technologyxxii (HJT), which offers higher efficiencies and occurs at low temperatures and with fewer production steps than other high-efficiency cell technologies.245 A number of China-based companies were actively looking into HJT, and some had small production lines in operation.246 European manufacturers were considering HJT (and other technologies) as an option to regain market share. 247 In late 2019, REC (Norway) started production at a HJT cell and module facility in Singapore.248

Researchers also were working to overcome the theoretical efficiency limits of silicon-based solar cells by stacking cells of different types and developing new, more efficient cell technologies.249 Perovskitesxxiii, in tandem with crystalline silicon or a thin-film base, are attracting substantial research dollars and seeing increasing efficiencies.250 Researchers continued to focus on the long-term stability of perovskites, lead content and other challenges during the year.251 By one estimate, more than a dozen companies worldwide were working on perovskites in 2019 with aims to sell panels soon (although some also pulled out of the market).252
Improvements in cell technology and module design have enabled the development of modules with higher power ratings.253 In 2019, for example, SunPower (United States) launched the industry’s most powerful residential panel, at 400-plus watts, and Canadian Solar unveiled what it claimed was the first poly bifacial module of 400-plus watts for large projects.254 Raising the power rating increases electricity output per module, thereby reducing the number needed for a project, meaning that less space is required and associated land, installation and other costs are reduced.255
Bifacial modules, which can capture light on both sides, also offer potential gains in output (and thus a lower LCOE) – with even greater performance gains if used in installations with trackersxxiv – although there are ongoing uncertainties about real-world performance.256 The scale of bifacial exports from China (the largest manufacturer of and market for bifacial panels) and the geographical distribution of demand increased considerably in 2019 thanks to improvements in cell technology.257 Several manufacturers announced plans to ramp up bifacial production or launched new products in 2019.258

Operators are playing a growing role in project development, working to maximise generation and to reduce the LCOE as direct government support declines and solar assets become exposed to market prices.259 Plant operations are increasingly digital and automated as rising competition pushes companies to further reduce costs, improve system performance and integrate energy storage.260 Digitalisation, thanks in large part to advances in inverterxxv technology, is helping to improve performance (for example, through predictive maintenance, remote sensing and control, satellite and ground-based as well as numerical solar forecasting schemes) and to provide grid services such as ramping capability and frequency regulation in order to support grid reliability. 261 (? See Systems Integration chapter.)
Remote maintenance and control technologies are improving efficiency and reducing O&M costs as well as outage times.262 Drone technologies are allowing operators to access and analyse performance data via remote thermographic imaging of facilities.263 Interest in robotic cleaning is increasing in India, Israel and elsewhere to reduce labour and other costs, save water and improve efficiency.264 In addition, research is under way to develop surface coverings that can reduce dust deposition on solar panels, an advance that improves system performance and lowers cleaning costs in dusty environments.265

Even as solar PV technologies and operations continue to advance, there is concern that low tender bidding and resulting low margins have negatively affected quality along the entire value chain.266 Poor quality – from product manufacturing and shipping, to project design and construction, to the commissioning and O&M stages – is a concern in a number of countries, as manufacturers feel pressure to cut corners in production or quality control and as developers seek the lowest-cost products.267 There are many areas where problems can enter in – particularly in emerging markets with rapid deployment as well as political and policy uncertainty.268 Although the volume of related literature is increasing, there is still limited understanding of the issues involved, and several countries continue to lack quality standards and regulations.269
To address some of these quality-related concerns, in 2019 India’s Ministry for New and Renewable Energy approved a series of guidelines for solar inverters under a quality control order that was first introduced in 2017.270 In Bangladesh, concerns about imports of sub-standard products that are threatening sustainability of the domestic market led the national government to introduce minimum quality standards on solar modules, inverters, charge controllers and batteries.271 Australia made significant progress on a new consumer code to establish minimum standards for consumer protection and good practice for solar PV, batteries and other emerging products and services.272 Also in 2019, global standards-making organisations continued working to establish rigorous standards for improving the quality of module production and system installation.273
Industry efforts to further advance environmental sustainability also continued in 2019. While the technical lifetimes of solar panels can be up to 25-40 years, the volume of decommissioned panels in the coming decade is expected to be large, and research into second-life (reuse) and end-of-life (recycling) options was ongoing in many countries during the year.274 PV Cycle (France) collected more than 280,000 solar PV panels for recycling.275 Also in 2019, Jinko Solar, the world’s top module manufacturer, became the first solar PV manufacturer to join RE100, pledging to source all of its energy from renewable sources, aiming for 70% by 2023 and 100% by 2025.276 It was followed, in early 2020, by LONGi, which committed to 100% renewable electricity across its operations by 2028.277
iFor the sake of consistency, the GSR endeavours to report all solar PV capacity data in direct current (DC); where data are known to be in AC, that is specified in the text and endnotes. See endnotes and Methodological Notes for further details.i
iiThis is the capacity additions of the country that ranked tenth for annual installations, the Republic of Korea.ii
iii“Distributed” solar PV in China includes ground-mounted systems of up to 20 MW that comply with various conditions, in addition to commercial, industrial and residential rooftop systems. Distributed generation consists largely of commercial and industrial systems and, increasingly, residential and floating projects. See endnote 26 for this section.iii
ivGrid parity in China refers to market-driven with no FIT support, but with priority off-taking. See endnote 34 for this section.iv
vEU throughout this text refers to the EU-28, including the United Kingdom. Not including the UK, EU additions in 2019 were over 15.7 GW for a year-end total of more than 118 GW. See endnote 76 for this section.v/a>
viMerchant deals (or projects) are those with no regulated or contracted income. The electricity generated is sold into competitive wholesale markets.vi
viiIndividuals, families, commercial enterprises and energy co-operatives that produce electricity with solar PV and consume at least some of it locally.vii
viiiIncludes commercial, government, non-profit and community solar PV systems.viii
ixThe ITC provided a 30% investment tax credit for projects that began construction by the end of 2019. The credit steps down to 26% in 2020, 22% in 2021 and 10% from 2022 onwards for commercial and utility projects, and for residential systems owned by companies; it falls to zero in 2022 for residential installations owned by homeowners. See endnote 116 for this section.ix
xFor example, a large corporation acts as “anchor tenant”, providing a strong credit rating to support project financing, and enabling the developer to build a larger project than the corporation requires. The developer then negotiates separate PPAs for the additional capacity with smaller purchasers, who have differing credit ratings, and who benefit from lower transaction costs and reduced complexity. Alternatively, a number of companies jointly negotiate an agreement, aggregating their individual capacity requirements in order to organise a larger deal and, thereby, to more cost-effectively acquire a PPA. See endnote 121 for this section.x
xiDistributed refers to systems that provide power to grid-connected consumers, or to the grid, but on distribution networks rather than bulk transmission, or off-grid systems. See endnote 178 for this section.xi
xiiCountries that added their first 50-plus MW plants in 2019 include Argentina, Belgium, Colombia, Jamaica, the Russian Federation, Saudi Arabia and Vietnam. See endnote 182 for this section.xii
xiiiAgricultural PV is defined as use of the same site for both energy and crop production. See endnote 194 for this section.xiii
xivBid prices do not necessarily equate with energy costs. Also, energy costs vary widely according to solar resource, project size, regulatory and fiscal framework, customer type, the cost of capital and other local influences. Distributed rooftop solar PV remains more expensive than large-scale solar PV but has followed similar price trajectories, and is competitive with (or less expensive than) retail electricity prices in many locations. See endnote 202 for this section.xiv
xvThe project includes 400 MW of solar PV capacity and 300 MW/12,000 MWh of energy storage capacity. See endnote 209 for this section.xv
xviCell capacity is MW or GW of semiconductor (cell) capacity available to a manufacturer; module assembly capacity is that available to assemble cells into modules.xvi
xviiTariffs on imports of these metals are significant because they are used to manufacture balance-of-systems equipment.xvii
xviiiIn April 2020, a decision was made to remove the exemption again, effective as of 18 May 2020; the tariffs are due to end in 2022.xviii
xixThe US solar “safe harbor agreement” governs when a solar PV project qualifies for the ITC. Projects that began construction before the end of 2019 qualify for the full 30% credit, which started to step down in 2020. To qualify, one option was to incur 5% of the total cost of a project before the end of 2019, and the easiest way for developers to do that was to buy up panels and inverters.xix
xxCrystalline technologies account for nearly all cell production. Historically, monocrystalline cells have been more expensive but also more efficient (more power per unit of space) than multi- or poly-crystalline cells, which are made of multi-faceted or multiple crystals. See endnote 240 for this section.xx
xxiPERC is a technique that reflects solar rays to the rear of the solar cell (rather than being absorbed into the module), thereby ensuring increased efficiency as well as improved performance in low-light environments.xxi
xxiiHJT combines advantages of conventional crystalline silicon solar cells with good absorption and other benefits of amorphous silicon thin film technology.xxii
xxiiiPerovskite solar cells include perovskite (crystal) structured compounds that are simple to manufacture and are expected to be relatively inexpensive to produce. They have achieved considerable efficiency improvements in laboratories, with reports of about 3% in 2006 to more than 24% in 2019, and 28% was achieved in a silicon-based tandem cell in 2018. See endnote 250 for this section.xxiii
xxivTrackers enable panels to track the movement of the sun. More and more large ground-mounted projects are using trackers because they flatten the production curve and increase yield. See endnote 256 for this section.xxiv
xxvInverters convert direct current electricity from solar panels to alternating current for the electric grid. xxv
ren21.net