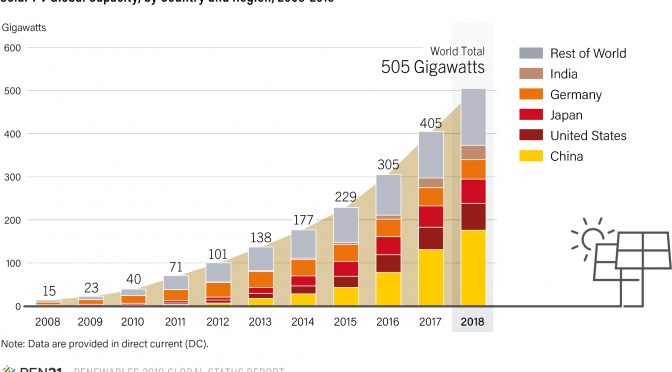
The annual global market for solar photovoltaics (PV) increased only slightly in 2018, but enough to surpass the 100 GW level (including on- and off-grid capacity) for the first time. Cumulative capacity increased approximately 25% to at least 505 GW; this compares to a global total of around 15 GW only a decade earlier. igher demand in emerging markets and in Europe, due largely to ongoing price reductions, compensated for a substantial market decline in China that had consequences around the world.

Despite the single-digit growth rate of the global market in 2018, solar PV has become the world’s fastest-growing energy technology, with gigawatt-scale markets in an increasing number of countries.
Demand
for solar PV is spreading and expanding as it becomes the most
competitive option for electricity generation in a growing number of
markets – for residential and commercial applications and increasingly
for utility projects – even without accounting for the external costs of
fossil fuels.
Eleven countries added more than 1 GW of new capacity
during the year, up from 9 countries in 2017 and 7 countries in 2016,
and markets around the world have begun to contribute significantly to
global growth. By the end of 2018, at least 32 countries had a
cumulative capacity of 1 GW or more, up from 29 countries one year
earlier.
There are still challenges to address in order for solar PV
to become a major electricity source worldwide, including policy and
regulatory instability in many countries, financial and bankability
challenges, and the need to integrate solar PV into electricity markets
and systems in a fair and sustainable manner.
But solar PV already plays a significant and growing role in electricity generation in several countries.
In 2018, it accounted for 12.1% of total generation in Honduras and substantial shares also in Italy (nearly 8.2%), Greece (8.2%), Germany (7.7%) and Japan (6.5%).
By
the end of 2018, enough capacity was in operation worldwide to produce
close to 640 TWh of electricity per year, or an estimated 2.4% of annual
global electricity generation.
In most countries, the need still
exists for support schemes for solar PV, as well as for adequate
regulatory frameworks and policies governing grid connections.
Government policies – particularly tenders and, to a lesser extent, traditional FITs – continued to drive most of the global market in 2018. Corporate purchasing of solar PV expanded considerably, and self-consumption was a significant driver of the market for new distributed systems in Europe and the United States.
Although
still a negligible share of the annual market, a number of purely
competitive (“unsubsidised”) systems were being constructed in 2018;
interest in this segment is significant and growing quickly.
For the
sixth consecutive year, Asia eclipsed all other regions for new
installations, despite declines in the region’s top three markets
(China, India and Japan). China alone accounted for around 45% of global
additions, but this was down from nearly 54% in 2017. Asia was followed
by the Americas. The top five national markets – China, India, the
United States, Japan and Australia – were responsible for about
three-quarters of newly installed capacity (down from about 84% in
2017); the next five markets were Germany, Mexico, the Republic of
Korea, Turkey and the Netherlands.
The
annual market size required to rank among the top 10 countries
continued to increase, reaching 1,330 MW in 2018 (up from 954 MW in
2017).
At year’s end, the leading countries for cumulative solar PV capacity were China, the United States, Japan, Germany and India.
China’s annual solar PV market declined for the first time since 2014 but the country had its second-biggest year so far, with 45 GW newly installed. While down more than 15% relative to 2017, the scale of new installations was greater than expected following significant subsidy reductions by the central government in May 2018, and the country’s additions were more than four times those of the next-largest market. By year’s end, China’s cumulative capacity of 176 GW was well beyond the national target of 105 GW by 2020 that was established in 2016.
These still-substantial additions came despite policy changes in China that reduced the FIT payment for solar generation, capped distributed projects at 10 MW for 2018, and ended approvals for new subsidised utility-scale plants (abolishing the 13.9 GW target for 2018), mandating that they go through auctions to set power prices. The policy changes also shifted project approval to local governments.
Key
factors driving China’s policy revisions included a backlog in FIT
payments and a growing deficit in the nation’s renewable energy fund, as
well as concerns about uncontrolled growth and a realisation that bids
under the country’s Top Runner programme were much lower than the
national FIT.
The changes reportedly signalled the central
government’s shift in focus from high-speed growth and dependence on
subsidies, to high-quality development in order to reduce costs through
technological improvements.
China’s market in 2018 was driven largely by the Top Runner and Poverty Alleviation programmes (and the FIT until late May).
Centralised
utility power plants (above 20 MW) accounted for nearly 53% of the
year’s installations (and 71% of the year-end total); the remainder was
in distributedii systems, which were up considerably in both their
capacity added in 2018 and their share of total additions relative to
previous years.
Curtailment of China’s solar PV generation continued
to decline, from a national average of 6% in 2017 to 3% in 2018,
although curtailment rates remained far higher in the remote provinces
of Gansu (10%, down 10 percentage points) and Xinjiang (16%, down 6
percentage points) due to insufficient transmission capacity.
Reduced
curtailment and rising capacity helped increase China’s solar PV output
50%, to 177.5 TWh.32 As a result, solar PV’s share of total annual
electricity generation in the country rose to 2.6% in 2018 (from 1.9% in
2017).
The second-largest market in Asia was India, which added an
estimated 10.8 GW for a total of around 32.9 GW. Installations were down
relative to the previous year, for the first time since 2014.
The decline was due to several factors, including land and transmission constraints, a safeguard dutyiv on imports from China and Malaysia (the sources of about 85% of India’s imports of solar product), flaws in the tender scheme and uncertainty surrounding the Goods and Services Tax, all of which affected large-scale installations.
Investment
in India’s solar sector fell 27% by one estimate, despite an increase
in investment in new manufacturing facilities, because of the decrease
in installations and the decline in system costs.
Even so, solar PV
was India’s largest source of new power capacity for the second year
running, and, for the first time, it accounted for more than half of the
capacity added during the year. India is targeting 100 GW of installed
solar PV by fiscal year 2022.
The Indian rooftop market continued to
grow rapidly, up about two-thirds during 2018 by one estimate. But total
rooftop capacity remained relatively low, reaching as much as a few GW
by year’s end, a long way from the national target of 40 GW by 2022.
The
rooftop market continued to consist mainly of large commercial and
industrial companies, as well as government entities and educational
institutions, all seeking to reduce their electricity bills; few
residential customers can afford the upfront costs.
As in recent
years, most of India’s newly installed capacity during 2018 was in
large-scale installations, with the bulk of this in five states:
Karnataka, Rajasthan, Andhra Pradesh, Tamil Nadu and Maharashtra. At
least three of these states (Andhra Pradesh, Karnataka and Tamil Nadu)
continued to face curtailment challenges, in the range of 10-25%, which
resulted in significant losses to project developers. More than 40 GW of
additional large-scale solar projects was tendered in India during
2018.
However, the gap expanded between tenders issued and auctions
completed. Many auctions were cancelled retroactively, and several
gigawatts of awarded capacity were annulled during the year.
The
market in Japan also contracted (down about 13%), for the third
consecutive year, with 6.5 GW added for a total of 56 GW. Japan’s market
continued to suffer from high prices of solar generation (Japan’s
prices are some of the highest worldwide), land shortages, grid
constraints and high labour costs.
The country’s first three tenders, held in late 2017 and 2018, resulted in relatively high bid prices and were undersubscribed.
Even
so, the number of large solar plants in Japan continued to grow,
raising some conflicts between developers and local citizens and their
governments due to concerns that include potential negative impacts on
landscapes and the natural environment.
By early 2019, the national
government was considering covering solar PV projects larger than 40 MW
under a revised national environmental assessment law.
Japan’s
residential rooftop sector remained fairly stable, and interest expanded
in the use of solar-plus-storage for selfconsumption.
The
market for larger rooftop systems also has grown as falling solar costs
relative to electricity from the grid have increased the commercial
sector’s interest in self-consumption.
Community power movements in Japan continued to make progress in their financing and business models.
For
the year, solar PV accounted for an estimated 6.5% of Japan’s total
electricity generation (11% in the Kyushu region), up from 5.7%
nationally in 2017. Late in the year, Japan’s first curtailment of solar
PV (and wind) generation occurred on the island of Kyushu due to
periods of high shares of variable renewable output combined with
inflexible nuclear generation, which also increased its share in the
electricity mix in 2018.
Elsewhere in Asia, the Republic of Korea added more than 2 GW to end 2018 with 7.9 GW.
The market has been driven primarily by a renewable portfolio standard (RPS).
Turkey
followed, installing 1.6 GW for a total of 5.1 GW, already surpassing
the national target for 2023. However, Turkey’s additions were down 37%
relative to 2017 due to several factors, including uncertainties
regarding national support schemes, issues related to land acquisition,
permission and financing, as well as delays as project developers await
further cost reductions.
Others in Asia to add capacity included
Chinese Taipei (almost 1 GW), driven by a FIT and a target of 20 GW by
2025, as well as Pakistan (0.5 GW) and Malaysia (0.4 GW).
Several
countries in the region held tenders, including Bangladesh and
Kazakhstan, which held its first solar auction; in the Philippines,
solar PV (and wind power) competed favourably against coal, and several
solar PV projects were approved for construction.
The Americas
accounted for around 14.5% of the global market in 2018, due largely to
the United States. The United States added an estimated 10.6 GW for a
total of 62.4 GW. California again led all states in added capacity (3.4
GW), and during the year it became the first US state to mandate solar
installations on most new homes (starting in 2020). California was
followed by Texas (added 1 GW) and North Carolina (0.9 GW). Overall, a
geographic shift in capacity additions continued, with progress in many
states that previously did not have significant markets.
The US
market as a whole was relatively stable (down 2%) compared to 2017. The
residential sector expanded 7%, driven by emerging state markets, but
the non-residential and utility-scale sectors contracted by 8% and 3%,
respectively. The decline in new utility-scale capacity commissioned
during the year was reportedly due largely to new federal duties on
imported solar cells and modules, which led to project cancellations and
delays
(timelines shifted based on the tariff schedule); the effects
of import tariffs were countered somewhat by a global oversupply of
modules (resulting from China’s policy changes and subsequent decline in
module demand), which drove down prices.
Late in the year, the US
market also was buoyed by increased interest from corporations,
including utilities, eager to begin construction of new projects before
the federal investment tax credit begins to phase out in 2020.
Companies
signed a total of 13.2 GW of utility-scale solar power purchase
agreements (PPAs), pushing the pipeline of contracted projects to the
highest level ever, at 28.3 GW. While commercial and industrial
off-takers were responsible for only 153 MW of capacity additions during
2018, they accounted for 21% (2.8 GW) of new deals signed, or 1 GW more
than in all previous years combined. Innovations such as aggregation
are helping to open the market for smaller businesses as well.
A few
of the US projects contracted in 2018 included energy storage;
large-scale solar-plus-storage projects are already undercutting new gas
plants in some markets (with the help of federal tax credit support).
Interest in solar-plus-storage is increasing in the US residential
market as well.To the south, several countries in Latin America and the
Caribbean are seeing a rapid expansion of annual installations, thanks
to an abundance of solar resources and a favourable political climate.
Large companies are flocking to the region
with expectations of massive expansion.
The
region’s top country for additions in 2018 was Mexico, which ranked
among the top 10 globally for the first time. Mexico added more than 2.7
GW (up from 285 MW installed in 2017), boosting its total capacity
five-fold to nearly 3.4 GW. This substantial growth in capacity resulted
from the grid connection of several very large projects (a result of
auctions as well as private PPAs) and from a significant increase in
distributed projects under Mexico’s net metering scheme.
Chile
followed Mexico in the region for cumulative capacity, with almost 0.5
GW installed for a total of 2.6 GW. Most of Chile’s capacity is in
large-scale projects, many of which support mining operations and other
major energy consumers.
Much of the capacity installed in Latin
America has occurred via large-scale PPAs, with many new ones announced
in 2018, and the region is home to a good portion of the world’s
merchantii solar plants.
But
distributed solar PV has begun to see significant growth, particularly
in Brazil, where cumulative distributed capacity surpassed 0.5 GW in
2018. Nearly 0.4 GW of this total was added during the year, thanks to
the extension of Brazil’s national net metering programme as well as to a
rising number of state-level incentives, falling module prices, rising
electricity tariffs and increased environmental awareness. In total,
Brazil added more than 1.1 GW in 2018, doubling its capacity to nearly
2.3 GW.
Access to financing remains a challenge in much of Latin
America for projects of all sizes due in part to volatile interest rates
and currency instability.
To
overcome these challenges, several developers have turned to green
bonds, which have been issued for projects in Argentina, Chile,
Colombia, Peru and Uruguay.
Europe was the third-largest region for
new installations (9.7 GW) but maintained its second-place ranking for
total operating capacity. The region continues to represent a shrinking
portion of cumulative global capacity as emerging economies with rapidly
growing electricity demand deploy more and more solar PV. In 2018,
however, demand increased significantly within the EU and beyond, with
the cost-competitiveness of solar energy stimulating investment also in
Belarus, the Russian Federation and Ukraine.90 Ukraine installed more
than 0.7 GW to nearly double its total capacity (1.6 GW), thanks to a
FIT for large-scale installations and net metering for smaller systems
enacted in part to address energy security concerns.
The EU added
around 8.3 GW of grid-connected solar PV in 2018, up 36% over the
previous year’s additions, bringing total capacity to 115 GW. Relative
to 2017, 22 of the 28 EU countries recorded higher installations, driven
by national binding targets for 2020, which many member states have yet
to meet. Other drivers included the removal of tariffs on Chinese solar
panels in September; rising emissions prices in the EU’s Emissions
Trading System, which improved the competitiveness of solar PV relative
to fossil fuels; and a continuing decline in solar PV system prices.
A
significant development in the EU in 2018 was the emergence of direct
bilateral PPAs for solar PV.95 Developers have begun to build projects
with plans to sign long-term PPAs with large industrial consumers (or
even to sell electricity to utilities at the market price).
One
estimate shows PPA activity in the region increasing from 360 MW in
2017 to 2.4 GW in 2018. By late 2018, about 15 projects that did not
rely on direct government subsidies to make a profit were under way in
the EU, and banks had begun to provide funding for such projects in
Italy, Spain and elsewhere.
Germany was the EU’s largest market,
regaining the region’s top spot for the first time in five years. The
annual market was up more than 70% relative to 2017, to nearly 3 GW,
bringing total capacity to 45.3 GW. The main drivers of the increase
were self-consumption and feed-in premiums for medium- and large-scale
commercial systems. By the end of 2018, Germany had more than 1.7
million solar PV systems. More than half of all new systems were
installed with storage, and approximately 120,000 solar-storage systems
were in operation by year’s end.
It also was a successful year for
lining up future capacity: solar tenders were over-subscribed, and solar
PV won all the capacity in Germany’s first joint auctions for solar and
onshore wind power.
The country’s solar output increased more than
17% in 2018 (to 46.2 TWh), due largely to unusually dry and sunny summer
weather, and amounted to 7.7% of annual gross electricity generation.
The
Netherlands has seen steady market growth since 2014 and, in 2018,
added a record 1.4 GW to close the year with 4.3 GW. While more than 40%
of additions were installed on residential rooftops, the market is
driven increasingly by utility-scale projects in the commercial sector,
where additions were up 90% relative to 2017.
France ranked third in the region for new installations (0.9 GW), despite a slight contraction relative to 2017.
France
was followed by Italy (which pushed its total capacity over 20 GW),
Belgium, Hungary and Spain, all of which installed around 0.4 GW. The
United Kingdom, which in 2017 ranked second in the region and ninth
worldwide for installations, saw its market continue to decline, to
below 0.3 GW, due to the removal of support policies.
In Italy and
Spain, installations rose slightly in 2018, following several years of
negligible installations; both markets have been driven predominantly by
self-consumption in recent years.
Self-consumption is playing an
important role in Australia as well. Solar energy is already cheaper
than electricity from the grid in most of the country, thanks to the
falling price of solar PV generation, existing subsidies for small-scale
installations, and high wholesale electricity prices. By late 2018,
more than 2 million Australian homes and businesses were powered by
rooftop solar PV, meaning that one in five households in Australia
generates at least some of its electricity with solar energy.
Australia’s capacity additions nearly tripled relative to 2017, to about 3.8 GW, raising total capacity to more than 11.1 GW.
Every
state and territory but Tasmania broke records for new capacity in
2018. Residential and commercial rooftop installations were up more than
40% (to nearly 1.6 GW), for a total of around 8 GW. Capacity additions
of large-scale utility projects surpassed annual additions of rooftop
systems for the first time: more than 2.4 GW was added, up from 0.1 GW
in 2017,
increasing the total capacity of utility projects to 3.1 GW.
At year’s end, more than 3 GW of additional large-scale capacity was
under construction.
The corporate PPA sector in Australia is still at
an early stage, but in 2018 it accounted for contracts worth hundreds
of megawatts of future capacity.
Generation from Australia’s rooftop
systems was boosted an estimated 22% during the year due to the
installation of additional capacity, but also as a result of greater
understanding among system owners of how to maximise system output, as
well as the use of smart energy management systems and monitoring
equipment; rooftop systems accounted for 4.2% of the country’s total
electricity consumption.
Overall,
Australia’s solar PV output increased more than one-third in 2018, at
the expense of coal and gas, to 11.7 TWh, or 5.2% of total generation.
The
rising penetration of rooftop and large-scale solar PV (and wind power)
continued to reshape Australia’s grid during the year, challenging
electric utilities. In Queensland, where about half of the new
large-scale capacity was installed, solar generation has depressed
wholesale power prices. The dramatic increase in large projects in 2018
began to cause network constraints; by year’s end, the greatest concerns
for project developers were delays and changing rules for grid
connections, which have resulted in cost-overruns and have undermined
investor confidence, slowing the project pipeline.
The Middle East
and Africa saw substantial progress in 2018, with an estimated 2.6 GW
added for a year-end total of at least 6.7 GW.
In
the Middle East, most of the new capacity was in the United Arab
Emirates (as much as 0.6 GW), Israel and Jordan (both adding around 0.4
GW). However, many countries across
the region have begun to take
advantage of falling solar PV prices to diversify away from fossil
fuels, or to power their oil and gas extraction industries.
Tenders were held during 2018 and early 2019 in several countries, including Jordan, Kuwait, Oman and the United Arab Emirates (Dubai and Abu Dhabi), and Lebanon held a 300 MW solar-plus-storage tender.
Distributed
solar PV generation remains a nascent market outside of Jordan and
Dubai, but in 2017 and 2018, several countries in the Middle East and
North Africa – including Egypt, Morocco, Oman, Saudi Arabia and Tunisia –
launched rooftop solar PV programmes to help
reduce energy costs and to secure reliable electricity in areas where supply does not meet peak loads.
From northern Africa to the continent’s southern tip, solar PV is viewed increasingl
Egypt
inaugurated the first phase of its planned 1.8 GW Benban solar park in
early 2018 and was Africa’s top installer for the year. A former gas
exporter, Egypt now imports liquefied natural gas at great expense, and
solar (in addition to wind) power represents part of the country’s plan
to expand energy options and reduce blackouts.
At year’s end,
Africa’s top countries for cumulative capacity were South Africa with
1.8 GW (added 60 MW), Egypt with nearly 0.7 GW (added at least 0.5 GW)
and Morocco, which added the vast majority of its 0.6 GW capacity during
2018.
Several
other countries on the continent held solar PV tenders or had large
plants being planned, under construction or commissioned in 2018.
Across
Africa and around the world, companies are erecting solar PV plants to
power their operations for mining, manufacturing and fossil fuel
extraction. Motivating factors include economics as well as favourable
regulations, environmental considerations and the flexibility of solar
power systems.
A firm in Zimbabwe announced plans in 2018 to construct a 300 MW solar PV facility rather than the originally planned 600 MW coal plant for platinum mining operations. In August, a US long-term electricity contract was signed for a 240 MW project to provide electricity for a steel manufacturer, reportedly the largest behind-the-meter solar PV project to date. Soon thereafter, two of the world’s largest coal mining companies announced a joint venture to invest more than USD 1.6 billion in 3 GW of solar power capacity in India.
Mining companies in Canada, Chile and elsewhere also have invested in solar PV (and wind power) capacity.
The
size and number of large projects continued to grow during 2018, with a
total of at least 235 solar PV plants of 50 MW and larger operating in
at least 37 countries (up from 28 in 2017) by year’s end.
Newly
commissioned plants included the 828 MW Villanueva park in Mexico, the
largest solar PV project in the Americas; the 750 MW Rewa project in
India, from which a quarter of the generation will be used to power the
Delhi Metro; and Jordan’s largest project to date (105 MW), which is
expected to provide enough electricity for 50,000 homes.142 Planning or
construction began on very large projects in nearly every region of the
world.
Large-scale plants can cover vast areas, raising concerns
about potential environmental impacts, grid-connection challenges and
the use of agricultural lands. Interest in floating solar PV is
increasing rapidly due in part to some of the concerns linked to
land-based projects. Hybrid solar PV-hydropower systems are at an early
stage, but they provide mutual benefits and have been proven at scale.
https://ren21.filecloudonline.com/url/ysphuvhv4tyxcpm4
https://www.evwind.es/2019/06/21/wind-power-industry/67665https://www.evwind.es/2019/06/18/renewables-now-supply-more-than-a-quarter-26-of-global-electricity/67622https://www.evwind.com/2019/06/18/energias-renovables-la-transformacion-del-sector-electrico-se-esta-acelerando/