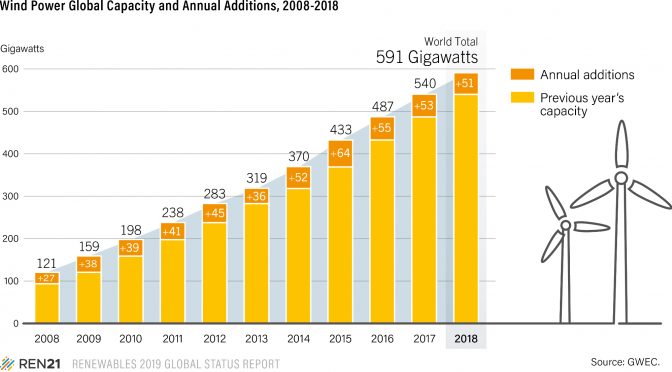
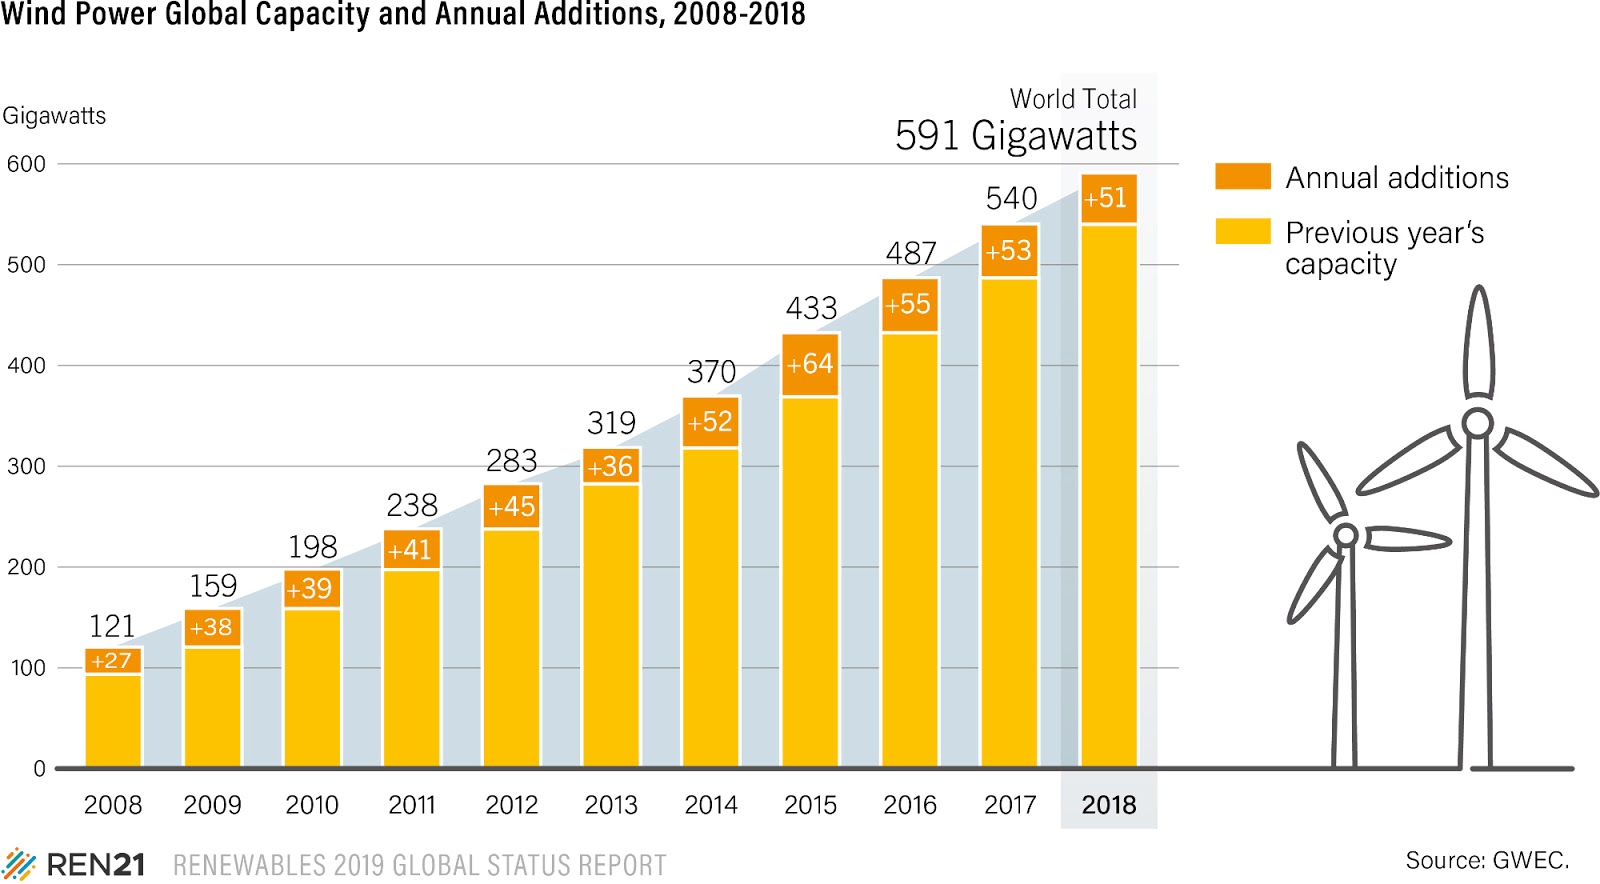
The global wind power market continued to be fairly stable in 2018,
with about 51 GW of capacity installed worldwide (including nearly 47 GW
onshore and 4.5 GW offshore), down approximately
4% from 2017.
Onshore wind farm installations accounted for all of the market decline.
This was the fifth consecutive year with annual additions exceeding 50 GW, but also the third year of decline following the peak in 2015, when China alone installed more than 30 GW in advance of policy changes.
The
additions in 2018 pushed cumulative capacity up 9% to 591 GW, with
about 568.4 GW onshore wind turbines and the rest operating offshore.
Following
a record year for wind power in Europe and India in 2017, both markets
contracted in 2018, but notable growth occurred in several other regions
and countries.
Emerging
markets across Africa, Southeast Asia,
Latin America and the Middle East together accounted for nearly 10% of
new installations, up from 8% the previous year.
New wind farms
reached full commercial operation in at least 47 countries during 2018,
and at least 3 countries (Bosnia and Herzegovina, Indonesia and Kosovo)
brought online their first commercial projects.
By year’s end, the
number of countries that had developed some level of commercial wind
power capacity was at least 103, and 33 countries – representing every
region – had more than 1 GW in operation.
Rapidly falling costs per
kilowatt-hour (both onshore and offshore) have made wind energy the
least-cost option for new power generating capacity in a large and
growing number of markets around the world.
As a result, the economics of wind energy have become the primary driver for new installations.
Outside
of China (with a FIT) and the United States (tax credits), most of the
global demand in 2018 resulted from tenders and other market-based
policies.
Targets for renewable energy and for reductions in CO2
emissions also continue to be important drivers of wind power
deployment, as they are for other renewable sources.
Also significant is the need for bulk power at a low price to meet rapidly rising electricity demand or to replace coal and nuclear power capacity as it comes offline.
Corporate PPAs are playing an important role
in mature markets: new PPAs during 2018 – mostly in North America (60%)
and northern Europe – were up more than 64% compared with 2017, to
nearly 6.4 GW.
Wind power provides a substantial share of electricity
in a growing number of countries. In 2018, wind energy covered an
estimated 14% of the EU’s annual electricity consumption and equal or
higher shares in at least six individual member states, including
Denmark, which met 40.8%i of its annual electricity consumption with
wind energy.
At least 12 countries around the world met 10% or more of their annual electricity consumption with wind energy in 2018, and some – including Costa Rica, Nicaragua and Uruguay – have seen rapid increases.
In Uruguay, the share of generation from wind energy rose more than five-fold in just four years, from 6.2% in 2014 to 33% in 2018.17 Shares also were high at the sub-national level in several countries (see below).
By year’s end, global wind power capacity
in operation was enough to contribute an estimated 5.5% of total
electricity generation.
For the 10th year running, Asia was the
largest regional wind turbines market, representing nearly 52% (up from
48%) of added capacity, with a total exceeding 262 GW by year’s end.
Europe (nearly 22%), North America (almost 16%) and Latin America and the Caribbean (over 7%) accounted for most of the rest of 2018 installations.
China retained its lead for new wind farm capacity (both onshore and offshore) and was followed distantly by the United States, Germany, India and Brazil, with the United Kingdom close behind. Other countries in the top 10 for capacity additions were France, Mexico, Sweden and Canada.
For cumulative capacity, the top 10 countries were unchanged from 2017.
China
in 2018 became the first country to exceed 200 GW of wind power
capacity, and saw an increase in new installations (up 7.5%) following
two years of decline. Approximately
21.1 GW was added (19.5 GW onshore and nearly 1.7 GW offshore), bringing total installed capacity to approximately 210 GW.
Around
20.6 GW was integrated into the national grid and started receiving the
FIT premium in 2018, with approximately 184.3 GW considered officially
grid-connected by year’s end.
Although the northern and western
provinces were still home to a large share (72%) of China’s cumulative
capacity by the end of 2018, nearly half (47%) of new installations were
in the country’s central and eastern regions.
The top provinces for additions during the year were Henan (2.4 GW), Hebei (2.1 GW) and Jiangsu (2.1 GW), all of which are relatively close to demand centres.
The
curtailment situation continued to improve as a result of policies to
expand electrification (especially of heating in industry), to encourage
direct trade in renewable energy among large consumers and to construct
new transmission lines, as well as limitations on new wind (and solar)
power capacity in problem areas.
Overall, an estimated 27.7 TWh of
potential wind energy was curtailed in China – a national average of 7%
for the year, down from 12% (41.9 TWh) in 2017 and 17% in 2016.29
Curtailment remained concentrated mainly in three provinces (Gansu,
Inner Mongolia and Xinjiang), but all three saw significant reductions
relative to 2017.
In late 2018, China re-emphasised its aim to keep curtailment of wind generation below 10% in 2019 and 5% in 2020.
Even
with curtailment, China’s generation from wind energy was up 20% (to
366 TWh) in 2018, and wind energy’s share of total generation continued
its steady rise, reaching 5.2% (up from 4.8% in 2017).
India was the
only other Asian country to rank among the top 10 for 2018
installations. The country climbed from fifth to fourth place, even
though additions fell nearly 50% from the record high in 2017.
India
added 2.2 GW in 2018, bringing the year-end total to 35.1 GW.34 Another
9.2 GW or more was in the pipeline, but many wind (and other) power
projects have been delayed by problems in obtaining land and accessing
transmission lines.
Elsewhere in Asia, Turkey’s annual installations
were down for the second year in a row, with 0.5 GW added for a total
approaching 7.4 GW at year’s end.
Fourth in the region was Pakistan, which added 0.4 GW, bringing its total to 1.2 GW, followed by Japan (nearly 0.3 GW, for a total of 3.7 GW).
Other countries in
Asia that added capacity included the Republic of Korea; Indonesia,
which added its first commercial wind farm during the year; and
Mongolia.
The EU installed roughly 10.1 GW of new capacity (7.4 GW
onshore and 2.7 GW offshore), or net additions of 9.7 GW (accounting for
decommissioning), for a year-end total of 178.8 GW (160.3 GW onshore
and 18.5 GW offshore).
Additions were down 35% relative to the record high in 2017, when developers rushed to install significant capacity ahead of regulatory changes that required competitive auctions for the allocation of support.
As a result, the EU saw the lowest
amount added since 2011, although most of the reductions occurred in
Europe’s largest markets, Germany and the United Kingdom.
In spite of
the absolute market contraction, wind power in the EU did not give up
much in relative market share. Wind power accounted for around half of
the EU’s net capacity additions in 2018 (55% in 2017), and by year’s end
it represented nearly onefifth (18.8%, up from 18% in 2017) of the
region’s total installed power capacity.
Wind energy’s share of EU electricity generation increased two percentage points over 2017 – even though 2018 was a less windy year – due to increased wind power capacity as well as lower electricity demand.
Onshore wind energy met approximately 12% of the region’s total electricity demand, and offshore wind energy met 2%.
In total, 16 EU countries added wind power capacity during 2018.
However,
the market was quite concentrated, with the top five countries –
Germany, the United Kingdom, France, Sweden and Belgium – accounting for
about 80% of net additions.
The leading EU countries for cumulative capacity were Germany, Spain, the United Kingdom, France and Italy.
Germany
was again the top installer in the region and the third largest
globally, adding 3.4 GW (more than 3.1 GW net, including almost 2.2 GW
onshore and nearly 1 GW offshore) for a cumulative total of around 59.3
GW at year’s end (with 52.9 GW onshore and 6.4 GW offshore).
Annual installations were about half those in 2017, ending a five-year period of rapid expansion.
Germany’s
market contraction reportedly was due to onerous permitting procedures,
local opposition and the shift from FITs to auctions, which initially
favoured citizen projects that were granted an extended period (4.5
years) for completion and thus were not yet in operation by year’s
end.49 Wind output increased 5.6% relative to 2017, accounting for 18.6%
of Germany’s total net electricity consumption in 2018.
The United
Kingdom also saw a significant market contraction (down 55% relative to
2017) with the transition away from its Renewables Obligation – 1.9 GW
was added (69% offshore) for a total approaching 21 GW.
Wind energy set new highs (onshore and offshore) for the year, generating 17.1% of UK electricity.
The
increase was due largely to capacity additions and to a new
transmission line between Scotland and Wales, which greatly reduced
curtailment of wind generation.
France added nearly 1.6 GW for a
total of 15.3 GW, and was followed by Sweden (plus 0.7 GW for a total of
7.4 GW) and Belgium (plus 0.5 GW; total 3.4 GW), which installed 60% of
its new capacity offshore.
Spain added 0.4 GW in 2018, the
country’s largest capacity increase since 2012, and continued to rank
second in the EU for cumulative capacity (23.5 GW).
Outside the EU,
Norway was the largest European installer (adding 0.5 GW) in 2018,
followed by Serbia, which increased its total capacity almost 20-fold to
nearly 0.4 GW.
Bosnia and Herzegovina (51 MW) and Kosovo (32 MW) added their first commercial wind farm capacity.
The Russian Federation commissioned its first commercial wind farm early in the year, and the first firm orders from the country’s wind power auction in 2017 were announced in late 2018.
Across all of Europe,
9.3 GW of new capacity was awarded during the year through government
auctions and tenders – including 2.3 GW offshore – and corporate deals
were signed for 1.5 GW of new wind power capacity (0.8 GW of it in
Norway) by firms ranging from aluminium and auto manufacturers to
pharmaceutical companies.
On the other side of the Atlantic, the
Americas accounted for more than 23% of the world’s newly installed
capacity in 2018, with the United States alone installing nearly 15% of
the global total.
The United States maintained its second-place ranking after China for annual additions, with 7.6 GW of capacity newly commissioned in 2018 (78% in the last quarter), an 8% increase over 2017.
By year’s end, 96.5 GW of capacity was in operation across 41 US states, with another 16.5 GW under construction.
Texas
continued to have a wide lead over other states for total capacity
(24.9 GW), and South Dakota became the 19th US state to have more than 1
GW of capacity in operation.
The United States is enjoying a
relatively prolonged period of policy certainty following more than two
decades of one- to two-year extensions of the federal production tax
credit.
State policies also have helped influence where deployment occurs, but wind power growth has outpaced state mandates and targets in recent years.
Corporate purchasing has played a significant
role in this trend, and US wind power PPAs had a record year in 2018:
utilities signed contracts for 4.3 GW, and non-utility customers
committed to purchase the generation from an additional 4.2 GW of wind
power capacity.
Wind power set short-term generation records in several regions of the United States, including in Texas.
For
the year as a whole, utility-scale wind power accounted for more than
30% of annual electricity generation in three US states (with Kansas in
the lead at 36.4%) and more than 20% of annual generation in six states;
in total, utility-scale wind power accounted for 6.6% of US electricity
generation.
Latin America and the Caribbean added nearly 3.4 GW of capacity in 2018, up more than 18% relative to 2017.
The region ended the year with about 25.6 GW of wind power capacity operating in at least 26 countries.
Brazil was home to more than half of the region’s total at year’s end and continued to rank among the global top 10 for both additions and cumulative installations. The country added around 1.9 GW in 2018, for a year-end total approaching 14.7 GW.
Wind power accounted for 8.3% of Brazil’s electricity generation in 2018 (up from 7.4% in 2017).
Mexico was among the world’s top 10 installers for the first time, adding more than 0.9 GW for a total of nearly 5 GW.
Other significant markets in the region included Argentina, one of the world’s fastest-growing wind power markets (adding 0.5 GW for a total exceeding 0.7 GW), Chile (0.2 GW; 1.7 GW) and Peru (0.1 GW; 0.4 GW).
Auctions and tenders have driven much of the wind power deployment in the region.
Canada’s
market expanded more than 60% relative to 2017, to nearly 0.6 GW,
putting it in 10th place for additions. Wind power has been the
country’s largest source of new electricity generation for a decade, and
the 12.8 GW in operation at the end of 2018 was enough to meet
approximately 6% of Canada’s electricity demand.
The province of
Ontario continued to lead in cumulative capacity (5 GW), followed by
Québec (3.9 GW), while Prince Edward Island had the country’s highest
share of wind energy in the electricity mix (28%).
Wind energy is
also playing an increasingly important role in Australia, which saw
records for both installations and output in 2018. The country brought
online more than 0.5 GW of new large-scale capacity, for a total
approaching 5.4 GW.
During the year, wind energy supplied 7.1% of
the country’s electricity, with far higher shares in South Australia
(35%), Victoria (28%) and New South Wales (19%).
The rapid increase
in the number and capacity of large wind (and solar) power projects in
Australia is challenging the country’s grid, resulting in project
delays. By year’s end, an additional 5.7 GW of capacity was under
construction or financially committed.
Other parts of Oceania had little wind power activity in 2018.
Africa
and the Middle East also saw a significant market increase (50%) from
2017, with most of the nearly 1 GW of new capacity coming online in
Egypt (380 MW), Kenya (310 MW) and Morocco (120 MW).
Kenya’s Lake Turkana Wind Power (LTWP) project finally began supplying electricity to the national gridi in September 2018, upon completion of a 436-kilometre transmission line. LTWP’s capacity factor has been very high, averaging 80% over the first two months of 2019.
Iran and Jordan also installed capacity during 2018, and Saudi Arabia held its first wind power tender.
Construction was expected to begin on Saudi Arabia’s first utility scale project in 2019.
At
year’s end, 12 countries in Africa and 4 in the Middle East had a
cumulative capacity of 5.7 GW of onshore wind power capacity, with South
Africa (2.1 GW), Egypt (1.2 GW) and Morocco (1 GW) accounting for most
of the total.
In the offshore segment, seven countries in Europe and
two in Asia connected a total of 4.5 GW in 2018 (the same as in 2017),
increasing cumulative global capacity by 24%, to 23.1 GW.
Wind turbines operating offshore represented only 4% of total global wind power capacity at year’s end, but offshore additions in 2018 accounted for 8% of all new capacity.
China had a record year and led the sector for the first time, installing 1.7 GW for a total of 4.4 GW.
The country is well within sight of its national target, which calls for 5 GW of offshore capacity by 2020. At least three Chinese provinces also have offshore targets, including Fujian (2 GW by 2020), Guangdong (30 GW by 2030) and Jiangsu (3.5 GW by 2020).
Elsewhere in Asia, the Republic of Korea commissioned turbines offshore (35 MW) during 2018.
Europe
continues to be home to most of the world’s offshore wind power
capacity. In 2018, the region added more than 2.6 GW (down 16% from
2017), for a regional total of 18.5 GW, most of which is in the North
Sea.
Leading countries for additions were the United Kingdom (1.3 GW), which completed the world’s largest offshore wind farm (the 657 MW Walney Extension), Germany (nearly 1 GW) and Belgium (0.3 GW).
Spain
installed its second offshore wind turbine, which has a self-installing
telescopic substructure for crane-less installations, and three
floating wind turbines were grid-connected off the UK and French coasts.
Although
Europe’s offshore capacity additions were below the record
installations in 2017, investment in offshore capacity (including
projects under construction) was up 37% in 2018 to its third-highest
level.
By the end of 2018, 17 countries (11 in Europe, 5 in Asia and 1 in North America) had offshore wind capacity.
The United Kingdom maintained its lead for total capacity (8 GW), followed by Germany (6.4 GW), China (4.4 GW), Denmark (1.3 GW) and Belgium (1.2 GW).
Europe was home to about 79% of global offshore capacity (down from 84% in 2017, and 88% in 2016), with Asia accounting for nearly all the rest. The success of offshore wind power in Europe – based on a well-developed supply chain, advances in installation and in O&M, several years of experience and the low cost of capital, all of which have made offshore wind power competitive in the region going forward – has sparked interest in almost every other region.
In
2018, studies continued for Australia’s first proposed wind farm, off
the coast of Victoria, and Brazil moved closer to seeing its first
offshore wind project.
Chinese Taipei held a tender for 1.6 GW of
capacity on top of previously allocated capacity (towards its target of
5.5 GW by 2025), and India set offshore targets of 5 GW by 2022 and 30
GW by 2030.
Poland committed to 8 GW by 2035, and Turkey announced
plans to hold an auction for the world’s largest offshore wind farm
(1.2 GW), which was later postponed.
The United States has added no
new offshore capacity since its first project (30 MW) was completed in
late 2016, but several states had supportive policies or ambitious plans
in place by early 2019 – including New Jersey (mandate for 3.5 GW by
2030) and New York (goal of 9 GW by 2035).109 In December, the winning
bids for lease areas off the coast of Massachusetts were far below the
previous US record.
The country’s first large-scale offshore wind
farm, the 0.8 GW Vineyard Wind project, was expected to begin
construction off the Massachusetts coast in 2019.
As the global offshore market continued to expand, the market for small-scale land-based wind turbines contracted further.
Small-scale
wind turbines are used for a variety of applications (both on- and
off-grid), including defence, rural electrification, water pumping and
desalination, battery charging, telecommunications and increasingly to
displace diesel in remote locations.
The global market continued
to slow in 2017 (latest available data) in response to unfavourable
policy changes and ongoing competition from relatively low-cost solar
PV.
By one estimate, 114 MW of new small-scale wind power capacity
was installed in 10 countries during 2017, down from an estimated 122 MW
in 2016.
Deployment was down significantly even in markets that
were growing until recently, including China and the United Kingdom. The
United States deployed an estimated 1.7 MW (3,269 units) in 2017,
continuing the country’s downward trend for turbines smaller than 100
kW. By year’s
end, approximately 1 million small-scale turbines, or at least 1.1 GW, were operating worldwide.
Wind
turbines of various sizes, totalling almost 0.5 GW of capacity, were
decommissioned in 2018. Decommissioning continued to occur primarily in
Europe, home to some of the oldest wind power markets. Germany accounted
for the largest number of decommissioned wind turbines, followed by the
Netherlands. Several of the decommissioned projects were repowered.
https://ren21.filecloudonline.com/url/ysphuvhv4tyxcpm4
https://www.evwind.es/2019/06/18/renewables-now-supply-more-than-a-quarter-26-of-global-electricity/67622https://www.evwind.com/2019/06/18/energias-renovables-la-transformacion-del-sector-electrico-se-esta-acelerando/