The 2015 edition of the BP Statistical Review of World Energy, launched today, highlights how significant changes in global energy production and consumption have had profound implications for prices, for the global fuel mix, and for global carbon dioxide emissions.
The 64th annual edition of the Statistical Review highlights the continuing importance of the US shale revolution, with the US overtaking Saudi Arabia as the world’s biggest oil producer and surpassing Russia as the world’s largest producer of oil and gas.
On the consumption side, the Statistical Review records primary energy consumption slowing markedly, with growth of just 0.9% in 2014, a lower rate than at any time since the late 1990s (other than in the immediate aftermath of last decade’s financial crisis). Chinese growth in consumption slowed to its lowest level since 1998 as its economy rebalances away from energy intensive sectors, though China remained the world’s largest growth market for energy.
Speaking at today’s launch, BP Group Chief Executive Bob Dudley said: “The eerie calm that had characterised energy markets in the few years prior to 2014 came to an abrupt end last year. However, we should not be surprised or alarmed. These events may well come to be viewed as symptomatic of a broader shifting of the tectonic plates that make up the energy landscape, with significant developments in both the supply of energy and its demand. Our task as an industry is to meet today’s challenges while continuing to invest to meet tomorrow’s demand, safely and sustainably.”
The shifts in production and consumption had major effects on energy prices as well as the fuel mix. For oil, prices have fallen sharply, largely driven by the strength of supply as non-OPEC production grew by a record amount while OPEC maintained its output levels to maintain market share. Elsewhere, the growth of China’s coal consumption stalled and global natural gas growth was also weak, held back by a mild European winter triggering a sharp fall in consumption.
Renewables were the fastest growing form of energy, accounting for one third of the increase in overall primary energy use during a year in which global primary energy consumption growth slowed. Even so, they accounted for only 3% of primary energy.
Global carbon dioxide (CO2) emissions from energy use grew by just 0.5%, the weakest since 1998 (other than in the immediate aftermath of last decade’s financial crisis). The slower growth relative to its average over the past 10 years or so was largely attributable to the changing pace and pattern of Chinese economic growth.
Review highlights – energy developments
- Growth of global primary energy consumption decelerated markedly in 2014, even though global economic growth was similar to 2013. Energy consumption increased by just 0.9% in 2014, a sharp deceleration over 2013 (+2.0%) and well below the 10-year average of 2.1%.
- Consumption increased for all fuels, reaching record levels for every fuel type except nuclear power. Production increased for all fuels except coal.
- Emerging economies continued to dominate the growth in global energy consumption, as they have on average over the past decade, but growth in these countries (+2.4%) was well below its 10-year average of 4.2%.
- Chinese consumption growth (+2.6%) was the slowest since 1998, yet China still recorded the world’s largest increment in primary energy consumption for the fourteenth consecutive year. OECD consumption experienced a larger than average decline (-0.9%), with weakness in the EU and Japan offsetting above-average growth in the US. The fall in EU energy consumption was the second-largest percentage decline on record (exceeded only in the aftermath of the financial crisis in 2009). Energy consumption in the EU fell to its lowest level since 1985.
- Growth was significantly below the 10-year average for Asia Pacific, Europe & Eurasia, and South & Central America.
- Oil remained the world’s leading fuel, with 32.6% of global energy consumption, but lost market share for the fifteenth consecutive year.
- Energy price developments in 2014 were generally weak, with oil and coal prices falling globally. Gas prices fell in Europe, were relatively flat in Asia, and rose in North America.
Oil
Prices
- Dated Brent averaged $98.95 per barrel in 2014, a decline of $9.71 per barrel from the 2013 level and the first annual average below $100 since 2010.
- Crude oil prices remained firm in early 2014 in the face of continued large supply disruptions, but fell sharply later in the year.
- The average WTI – Brent differential narrowed to $5.66 per barrel (from $10.67 in 2013) despite continued robust US production growth, but remained elevated relative to past levels.
Consumption and production
- Global oil consumption grew by 0.8 million barrels per day (bpd), or 0.8% – a little below its recent historical average and significantly weaker than the increase of 1.4 million bpd seen in 2013.
- Countries outside the OECD accounted for all of the net growth in global consumption. Chinese consumption growth was below average but still recorded the largest increment to global oil consumption (390,000 bpd).
- OECD consumption declined by 1.2%, the eighth decrease in the past nine years. Light distillates (motor and aviation gasoline, light distillate feedstock) were the fastest-growing refined product category for a second consecutive year.
- Global oil production growth was more than double that of global consumption, rising by 2.1 million bpd or 2.3%.
- Production outside OPEC grew by 2.1 million bpd, the largest increase in our dataset. The US (+1.6 million bpd) recorded the largest growth in the world, becoming the first country ever to increase production by at least 1 million bpd for three consecutive years, and taking over from Saudi Arabia as the world’s largest oil producer. Along with the US, production in Canada (+310,000 bpd) and Brazil (+230,000 bpd) also reached record levels in 2014.
- OPEC output was flat, and the group’s share of global production fell to 41%, its lowest since 2003.
Refining and trade
- Global crude runs rose by 1.1 million bpd (1.4%) in 2014 – the highest growth since 2010 and more than double the 10-year average. Refinery runs in the US rose by 530,000 bpd, the largest increase since 1986.
- Global refining capacity expanded by an above average 1.3 million bpd, led by additions in China and the Middle East, with Middle Eastern capacity expanding by a record 740,000 bpd.
- Global refinery utilization remained at 79.6%, its lowest rate since 1987.
- Global trade of crude oil and refined products in 2014 grew by a below average 0.9%, or 490,000 bpd.
- Import growth was driven by China and other emerging economies, while US net imports declined. China replaced the US as the world’s largest net oil importer in 2013.
Natural gas
Consumption and production
- World natural gas consumption grew by just 0.4%, well below the 10-year average of 2.4%. Growth was below average in both the OECD and emerging economies, with consumption in the EU (-11.6%) experiencing its largest volumetric and percentage declines on record. The Europe & Eurasia region (-4.8%) had the five largest volumetric declines in the world in Germany, Italy, Ukraine, France and the UK. Globally, natural gas accounted for 23.7% of primary energy consumption.
- Global natural gas production grew by 1.6%, below its 10-year average of 2.5%. Growth was below average in all regions except North America. The US (+6.1%) recorded the world’s largest increase, accounting for 77% of net global growth. The largest volumetric declines were seen in Russia (-4.3%) and the Netherlands (-18.7%).
Trade
- Global natural gas trade registered a rare contraction in 2014, falling by 3.4%.
- Pipeline shipments declined by 6.2%, the largest decline on record, driven by falls in net pipeline exports from Russia (-11.8%) and the Netherlands (-29.9%). Global LNG trade increased by 2.4%. International natural gas trade accounted for 29.4% of global consumption; LNG’s share of global gas trade rose to 33.4%.
Other fuels
Coal
- Global coal consumption grew by 0.4% in 2014, well below the 10-year average annual growth of 2.9%. Coal’s share of global primary energy consumption fell to 30.0%.
- Consumption outside the OECD grew by 1.1%, the weakest growth since 1998, driven by a flattening of Chinese consumption (+0.1%). India (+11.1%) experienced its largest volumetric increase on record, and the world’s largest volumetric increase. Global coal production fell by 0.7%, with large declines in China (-2.6%, the world’s largest volumetric decline) and Ukraine (-29.0%) more than offsetting large increases in India (+6.4%) and Australia (+4.7%).
Nuclear and hydroelectric
- Global nuclear output grew by an above-average 1.8%, the second consecutive annual increase, and the first time nuclear power has gained global market share since 2009.
- Increases in nuclear output in South Korea, China and France outpaced declines in Japan, Belgium and the UK.
- Global hydroelectric output grew by a below average 2.0%. Hydroelectric output accounted for a record 6.8% of global primary energy consumption.
- Chinese hydroelectric output growth (+15.7%) accounted for all of the increase in global output.
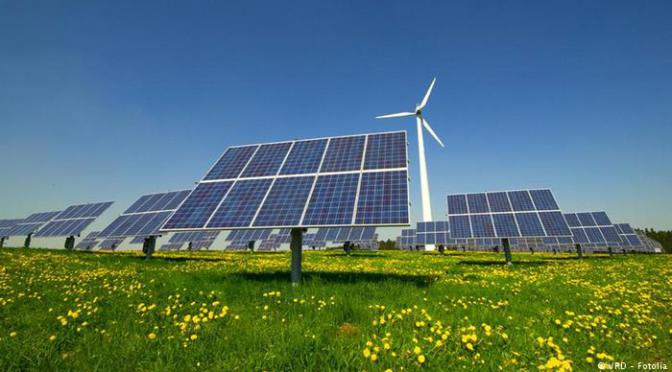
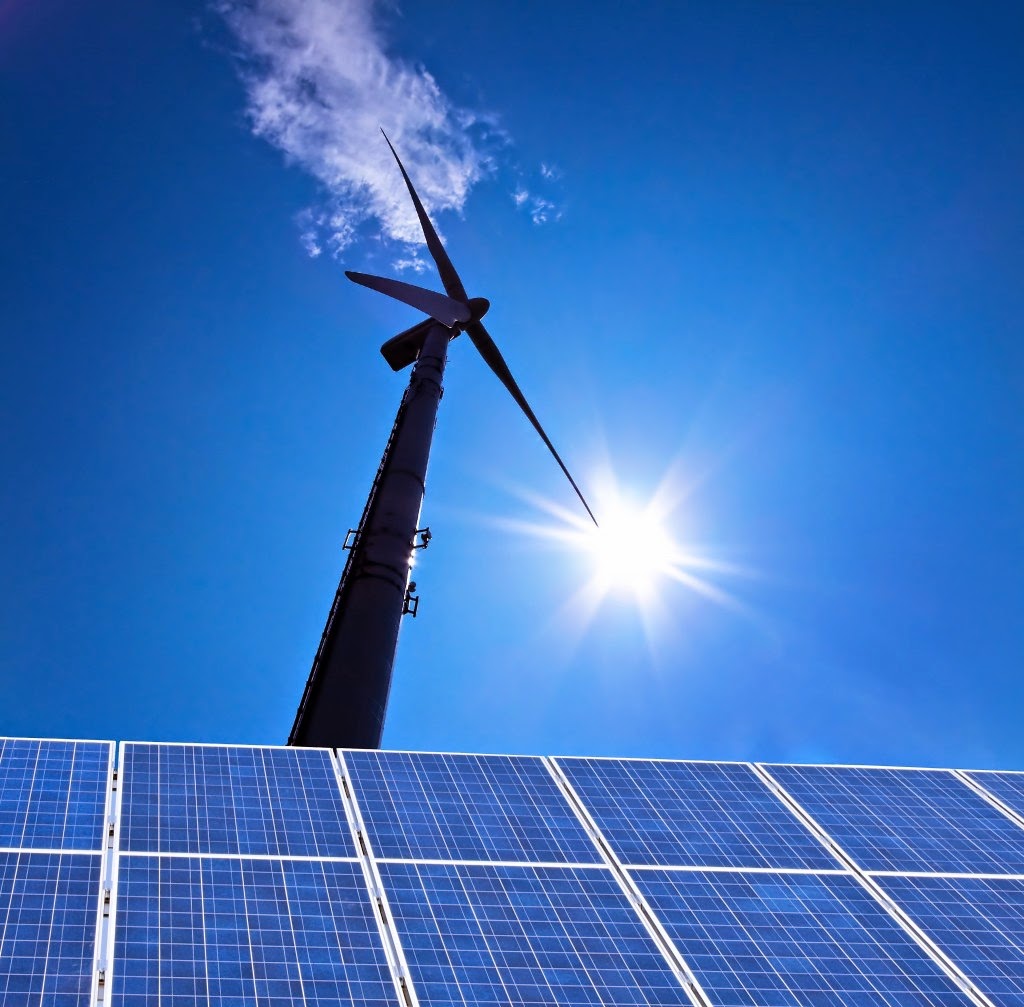
Renewables (including wind, solar, and biofuels)
- Renewable energy sources – in power generation as well as transport – continued to increase in 2014, reaching a record 3.0% of global energy consumption, up from 0.9% a decade ago.
- Renewable energy used in power generation grew by 12.0%, and renewables accounted for a record 6.0% of global power generation.
- China recorded the largest increment in renewables in power generation for a fifth consecutive year; growth last year (+15.1%) was one-third the 10-year average.
- Globally, wind energy (+10.2%, +65 terawatt-hours) grew by less than half of its 10-year average.
- Solar power generation grew by 38.2% (+51 terawatt-hours).
- Global biofuels production grew by a below average 7.4% (+144,000 bpd).