In the power sector, global capacity reached 1,560 gigawatts (GW) in 2013 – an increase of about 8.3 per cent over 2012 – and renewables accounted for more than 56 per cent of net additions to global power capacity.
REN21’s Renewables Global Status Report (GSR) offers a comprehensive look at the state of the industry. Here are the key stats.

In the power sector, global capacity reached 1,560 gigawatts (GW) in 2013 – an increase of about 8.3 per cent over 2012 – and renewables accounted for more than 56 per cent of net additions to global power capacity.
By the end of 2013, China, the US, Brazil, Canada, and Germany remained the top countries for total installed renewable power capacity; the top countries for non-hydro capacity were again China, the United States, and Germany, followed by Spain, Italy, and India.
- Among the world’s top 20 countries for non-hydro capacity, Denmark had a clear lead for total capacity per capita, while Uruguay, Mauritius, and Costa Rica were among the top countries for investment in new renewable power and fuels relative to annual GDP.
- China’s new renewable power capacity surpassed new fossil fuel and nuclear capacity for the first time.
- In the EU, renewables represented the majority of new electric generating capacity for the sixth consecutive year. The 72 per cent share in 2013 is contrasts to a decade earlier, when conventional fossil generation accounted for 80 per cent of new capacity in the EU-27 plus Norway and Switzerland.
- During 2013, wind power met 33.2 per cent of electricity demand in Denmark and 20.9 per cent in Spain; in Italy, solar PV met 7.8 per cent of total annual electricity demand.

Solar Power
- For the first time, more solar photovoltaics (PV) than wind power capacity was added worldwide in 2013.
- Around 38GW of solar PV came online, taking the total to around 138GW, with China accounting for a third of global capacity added. This 27 per cent increase in new capacity installations came despite global investment in solar PV declining nearly 22 per cent relative to 2012.
- Global Concentrated Solar Thermal Power (CSP) capacity rose 0.9GW over 2013 to reach 3.4GW. The US and Spain remain market leaders but outside these markets capacity nearly tripled with projects coming on line in the United Arab Emirates, India, and China.
- Solar thermal heating and cooling reached an estimated 330GW by the end of 2013, up from 283GW in 2012. China was the main demand driver, accounting for more than 80 per cent of the global market, but other countries such as Brazil expanded their share.
Wind Energy
- More than 35GW of wind power capacity was added in 2013, for a total above 318GW. Following several record years the market was down more than 10GW from 2012 after a steep drop in the US market. Offshore wind accounted for a record 1.6GW of new capacity, almost all in the EU.
- The UK is sixth in the world in terms of installed wind capacity, behind China, the US, Germany, Spain, and India.
- Wind power was excluded from one of Brazil’s national auctions because it was pricing all other generation sources out of the market.
- 71 countries have more than 10MW of wind power and 24 countries more than 1GW installed.
Other renewables
- About 40GW of new hydropower capacity was commissioned in 2013, increasing total global capacity by around four per cent to 1,000GW, with China leading the way on 29GW.
- Ocean energy capacity, mostly made up of tidal power generation, was about 530MW by the end of 2013, with the UK and France leading pilot installations.
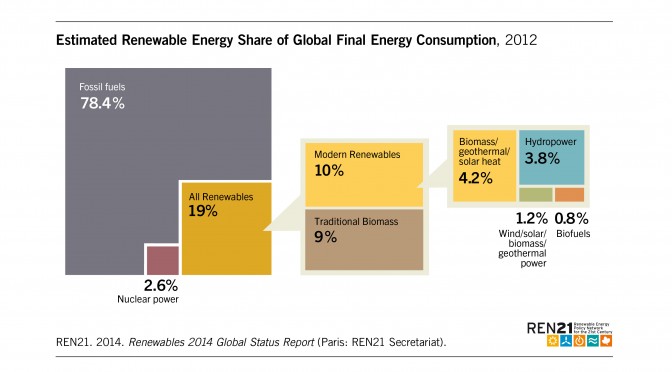
- Heat from modern biomass, solar, and geothermal sources accounts for a 10 per cent of final global heat demand but its share is gradually rising.
- About 530MW of new geothermal generating capacity came on line in 2013, taking global capacity to 12GW.
- There are around 6.5 million jobs worldwide in renewable energy, with solar PV accounting for 2.3 million, biofuels 1.5 million, and wind 834,000.
Policy
- By early 2014 at least 144 countries had renewable energy targets and 138 countries had renewable energy support policies in place, up from the 138 and 127 countries respectively identified in last year’s report. Developing and emerging economies account for 95 of the countries with support policies, up from 15 in 2005.
- Feed-in policies and renewable portfolio standards (RPS) remain the most commonly used support mechanisms, although their pace of adoption is slowing. Public competitive bidding, or tendering, is gaining prominence, with the number of countries turning to public auctions rising from nine in 2009 to 55 as of early 2014.
- By early 2014 at least 24 countries had adopted renewable heating (and cooling) targets, and at least 20 countries had obligations at the national or state/provincial level.
- And at least 63 countries used regulatory policies to promote the production or consumption of biofuels for transport; up from the 49 reported in 2013.
- A growing number of countries and regions have committed to transition to 100 per cent renewables by 2020, including Scotland, Djibouti, and Tuvalu.
Investment
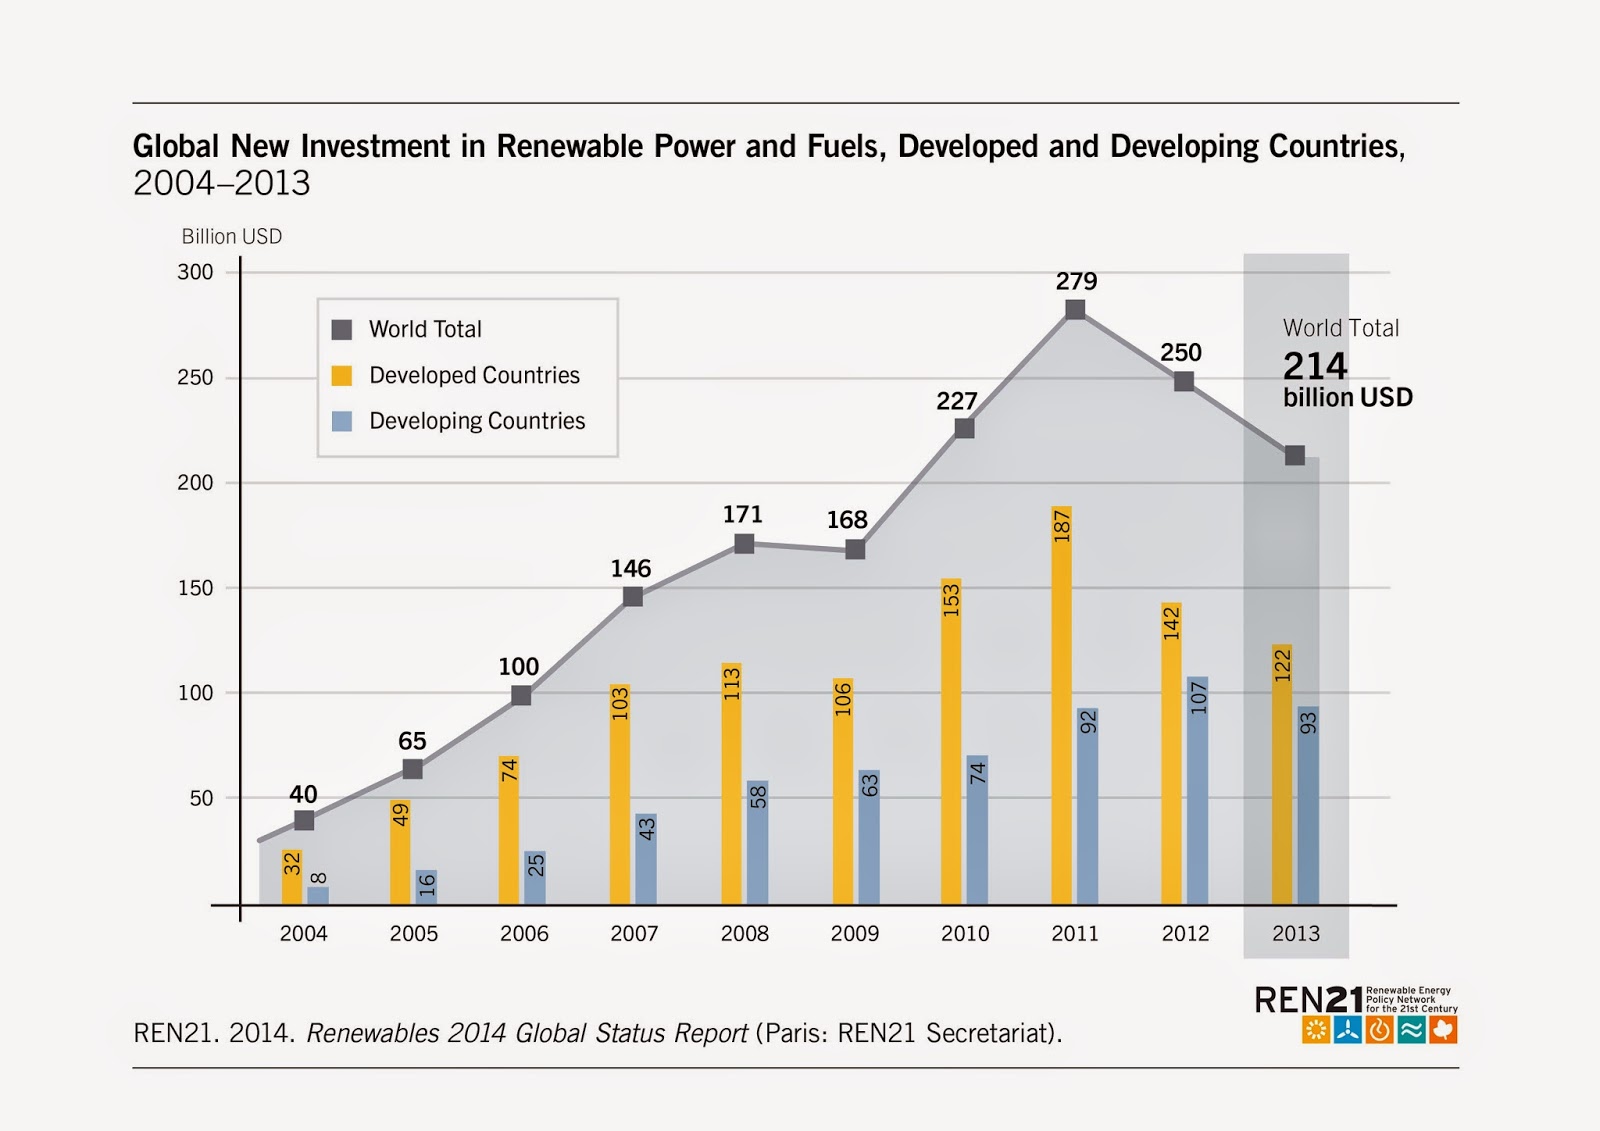
- Global new investment in renewable power and fuels – not including hydropower projects larger than 50MW – hit an estimated $214.4bn in 2013, down 14 per cent relative to 2012 and 23 per cent lower than the record level in 2011. Slowdown attributed to uncertainty of support policies in the US and Europe along with sharp reductions in technology costs.
- Europe’s renewable energy investment was down 44 per cent from 2012 last year, which also saw an end to eight consecutive years of rising renewable energy investment in developing countries.
- Considering only net investment in new power capacity, renewables outpaced fossil fuels for the fourth year running.
- The UK, Canada, Chile, Israel, New Zealand, and Uruguay all bucked the trend by increasing their investment in renewable energy in 2013, while Japan say investment rise by 80 per cent relative to 2012 levels.
- Despite the overall decline in China’s investment, for the first time ever it invested more in renewable energy than all of Europe combined – and it invested more in renewable power capacity than in fossil fuels.
- Solar power led the way receiving 53 per cent – $113.7bn – of total new investment in renewable power and fuels, 90 per cent of which went to PV. Wind power followed with $80.1bn.
http://www.ren21.net/Portals/0/documents/Resources/GSR/2014/GSR2014_full%20report_low%20res.pdf