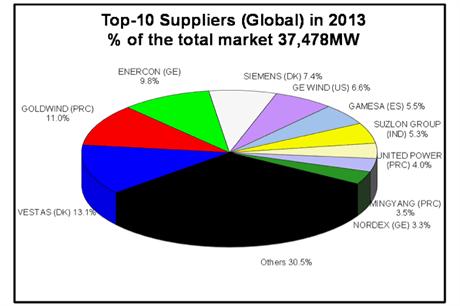
Vestas Wind Systems A/S (VWS) grabbed the biggest share of the wind-turbine market in 2013, regaining a lead that it lost last year to General Electric Co. Vestas took 13.1 percent of the total market of 37,478 megawatts, Navigant Consulting Inc. said today in a report on its website. China’s Xinjiang Goldwind Science & Technology Co. and Germany’s Enercon GmbH came second and third, while Siemens AG and GE placed fourth and fifth, dropping places due to a decline in the U.S. market, where they’re usually strong, according to Navigant.

- Vestas 13.1%
- Goldwind 11%
- Enercon 9.8%
- Siemens 7.4%
- GE 6.6%
- Gamesa 5.5%
- Suzlon 5.3%
- United Power 4%
- Ming Yang 3.5%
- Nordex 3.3%
While Vestas topped the ranking, its share was still lower than the 14 percent it had in Navigant’s survey for 2012. Goldwind’s share rose to 11 percent from 6 percent; Enercon took 9.8 percent compared with 8.2 percent; Siemens slipped to 7.4 percent from 9.5 percent and GE’s share dropped to 6.6 percent from 15.5 percent.
The top 10 was rounded out by Spain’s Gamesa Corp. Tecnologica SA, India’s Suzlon Energy Ltd., China’s Guodian United Power Technology Co., China Ming Yang Wind Power Group and Germany’s Nordex SE. The Navigant study is compiled by its BTM Consult unit.
The BTM wind report, World Market Update 2013, published by Navigant Research, is the 19th edition of this annual wind energy market report. The report includes more than 70 tables, charts and graphs illustrating global wind market development, as well as an on- and off-shore wind market forecast for 2014-2018 and predictions for the wind market through 2023.
World Market Update 2013 includes a full chapter dedicated to the global onshore wind operation and maintenance market. Research underlying this chapter of the report discloses that more than 314 GW of onshore wind requiring service and maintenance was installed by the end of 2013, representing 98% of global wind turbine installations. At least 100 GW of that total is now out of warranty, with responsibility for operations and maintenance (O&M) falling to the owners. Demand for O&M services from original wind equipment manufacturers (OEMs) and independent service providers (ISPs) is expected to grow at by 40 GW a year from 2013 onward, representing a significant wind power business separate from that of constructing wind farms. Leveraging the BTM-Navigant historical data, a special chapter in this year’s World Market Update quantifies the O&M market, estimates its value, describes the choice between OEM and ISP, reviews current onshore O&M strategies, examines contract models and provides an overview of trends and challenges.
Highlights of this report include:
- Global installation in 2013 of 36.13 GW
- Vestas recaptures the No.1 position after it lost its leading position to GE Wind in 2012.
- China regains its title as the world’s largest annual market with 16,088 MW of new wind power installed in 2013
- Offshore wind grows over 50% annually in 2013 and lines up for steady growth in Europe
- Direct drive turbines take 28.1% of the global market even as traditional DFIG regains popularity
- Goldwind’s GW1.5 MW was the most frequently installed wind turbine in 2013
- Wind power will deliver at least 2.87% of the world’s electricity in 2014, growing to 7.28% in 2018
- Wind power capacity installations in 2014 are expected to rebound with 29.6% growth
Table of Contents
1. Preface
2. Executive Summary
3. Introduction
3.1 Methodology
3.2 Sources
3.3 Significant Events in the Wind Industry: 2013
3.3.1 Company News
3.3.2 Selected Political Events
4. Market Development 2013 – Demand Side
4.1 Global Installation Streak Falters in 2013
4.2 Market Status of Wind Power Market by Country by End of 2013
4.2.1 Americas
4.2.2 Europe
4.2.3 South and East Asia
4.2.4 OECD Pacific Region
4.2.5 Rest of the World
4.3 The Offshore Wind Market in 2013
4.4 Overview of Global Wind Turbine Fleet
4.5 The Top 10 Markets in the World
4.6 Commercial MW Technology in the Market
4.6.1 Larger Onshore Wind Turbines
4.6.2 Multi-Megawatt Offshore Wind Turbines
4.6.3 The Direct Drive Concept
5. Market Development 2013 – Supply Side
5.1 Accounting Methodology and Standardization
5.2 China Leads Top 15 and Takes Second Place in 2013 Ranking
5.3 Positives and Negatives in Reliance on Domestic Market
5.4 Trends in the Competitive Market
5.5 Offshore Market Boosts Growth in Sales of Multi-Megawatt-Scale Turbines
6. Wind Power Plant Owners
6.1 Institutional investors Join and Add to Diversification of Wind Asset Ownership
6.2 China and New Markets Hot Spots of Activity as Old Markets Struggle with Economic Recession
6.3 Chinese Utilities Continue to Move up the Top 15 Wind Asset Owners Rankings
6.4 Tough Market Conditions Forced Major Owners to Optimize Assets and Pipeline
6.5 Large Wind Power Investors with Growth Potential
6.6 New Entrants, Cash-Rich Investors Seize Opportunities in Tough Economic Times
7. Forecast and Estimates
7.1 5-Year Market Forecast for 9% Growth to 2018
7.2 Commentary by Country and Regions
7.2.1 American Continent
7.2.2 Europe
7.2.3 Other European Countries with Strong Forecasts through 2018
7.2.4 Asia Pacific
7.2.5 Africa
7.2.6 Central Asia and the Middle East
7.3 Economic Value of Global Wind Market to 2018 Forecast at €343 Billion
7.4 Emerging Markets on Steady Course for Growth
7.5 Offshore Wind Will Make up a Sizable Portion of Global Wind Market by 2018
7.5.1 Offshore Wind Market Outlook by Country: 2014-2018
7.5.2 Challenges Remain in the Offshore Wind Industry for 2014-2023
7.6 Expectations and Predictions for Development: 2019-2023
7.6.1 Trends Supporting the Wind Growth Prediction
7.7 Geopolitical Issues: Slow Progress on Climate Change Policies Limits Drivers for Wind
7.7.1 UN Climate Negotiations and the Kyoto Protocol
7.7.2 European Energy Policy and Regulation
8. Penetration of Wind Power Electricity and Wind Market Structures
8.1 Methodology and Assumptions
8.2 Strong Relative Growth of Wind Contribution to Global Electricity Supply
8.3 Radical Changes to Wind Market Structures Create Climate of Uncertainty
9. Special Theme: Global Onshore Wind Operations and Maintenance Market
9.1 Introduction
9.1.1 Historic Perspective
9.1.2 Current Market Status and Opportunities
9.1.3 Definitions and Terminology
9.1.4 Methodology
9.2 Size of Global Onshore O&M Market and Its Value
9.2.1 Charted Growth and Current Size of Onshore O&M Market: 1995-2013
9.2.2 Segmentation of Global Onshore O&M Market by Wind Turbine Size
9.2.3 Segmentation of Global Onshore O&M Market by Wind Turbine OEM in Selected Size Classes
9.2.4 Projected Growth of Onshore Wind O&M Market: 2013-2023
9.2.5 Value of the Global Market for Wind Turbine Service and Maintenance
9.2.6 Overview of Global O&M Market and Selected Service and Maintenance Providers
9.3 Strategies for Onshore Wind O&M Post Warranty Expiry
9.3.1 Diversity of Owners Requires Flexible Solutions
9.3.2 Reactive, Corrective, Preventive, Predictive
9.3.3 Condition Monitoring and Data Handling
9.3.4 Risk-Based Maintenance and Reliability-Centred Maintenance
9.3.5 Spare Parts and Logistics
9.3.6 Component Upgrades and Refurbishment
9.3.7 Health and Safety
9.4 Onshore Wind O&M Contract Models
9.4.1 Selection of O&M Provider
9.4.2 Warranty Contract
9.4.3 Full Service Contract
9.4.4 Hybrid Contract
9.4.5 Basic Contracts
9.5 Trends and Challenges in Onshore Wind Operations and Maintenance
9.5.1 The ISP Challenge
9.5.2 Bolt-Ons from Entrepreneurial Start-Ups
9.5.3 Advances in Control Systems
9.5.4 More Meaningful SCADA
9.5.5 Coupling of Technical Operation with Commercial Operation
9.5.6 Systemised Knowledge Sharing
9.6 Conclusion: A Market with good Visibility Served by an Industry in its Infancy
10. Appendix A: Profiles of Leading Wind Turbine Manufacturers
11. Appendix B: Profiles of Major Sub-Suppliers
12. Appendix C: Profiles of Major Wind Project Developers/Owners
13. Acronym and Technical Units
14. Table of Contents
15. Table of Charts and Figures
16. Index
17. Sources and Methodology
List of Figures
- Top 10 Wind Turbine Suppliers Globally: 2013
- Annual Wind Power Development: 2014-2018
- Annual and Cumulative Global Wind Energy Development: 1983-2013
- Total Installed Wind Power Capacity: End of 2007, 2010, and 2013
- Typical Onshore Wind Turbine Development Timeline
- Top 10 Suppliers: 2013
- Change in Market Share: 2012-2013
- Global Footprint of Top 10 Wind Turbine Manufacturers: 2013
- Market Share of Major Utilities and IPPs
- Cumulative Installed Capacity by Region at the End of 2013 and by 2018
- Forecast of Annual Installation: 2014-2018
- Expected World Market: 2013-2018
- Annual Global Wind Power Development Forecast: 1990-2013 and 2018-2023
- Prediction for Cumulative Installed Wind Capacity: 2018 and 2023
- Cumulative Wind Power Development to 2023
- EUA Emissions Credits (€): 3Q 2010-1Q 2014
- Growth of Global Onshore Wind Market for O&M, in Warranty and Off Warranty: 1995-2013
- Global Onshore Market for O&M by Wind Turbine Size Class: 1995-2013
- Global Onshore Market for O&M by Wind Turbine Size Class: 1995-2013 (Number of Units)
- Breakdown of OEMs in the 750 kW to 999 kW Turbine Size Group of the Global O&M Market
- Breakdown of OEMs in the 1,301-1,500 kW Turbine Size Group of the Global O&M Market
- Breakdown of OEMs in the 1.5 MW to 2.5 MW Turbine Size Group of the Global O&M Market
- Growth of Global Onshore Wind Market for O&M, in Warranty and off Warranty: 2013-2023
- Projected Value of the Out-of-Warranty Onshore Market for Wind Turbine O&M: 2013-2023
- Broad Contract Models for O&M Applicable to Different Periods of a Wind Plant Lifespan
- Typical Modules Offered by Service Providers for Flexible Packaging of O&M
List of Tables
- Wind Power Development, World Markets: 2013
- World Market Growth Rates: 2008-2013
- Global Installed Capacity: 2012 and 2013
- Installed Capacity, Americas: 2012 and 2013
- Installed Capacity, Asia: 2012 and 2013
- Installed Capacity, Rest of World: 2012 and 2013
- Installed Capacity, Europe: 2012 and 2013
- Global Installed Offshore Wind Power: 2012-2013
- Global Offshore Wind Test Sites
- Global Operating Wind Farms: End of 2013
- Offshore Wind Farms under Construction: End of 2013
- Wind Turbines Worldwide: End of 2013
- Average Size Wind Turbine (kW) Installed: 2008-2013
- Average Size Wind Turbine (kW), Cumulative Installation: 2008-2013
- Top 10 Markets by Annual Installed MW: End of 2013
- 10 Largest Markets by Cumulative MW: End of 2013
- Growth Rates in the Top 10 Markets: End of 2013
- Selected MW Class of Onshore Wind Turbines in the Market
- Selected MW Class of Onshore Wind Turbines in the Market (Continued)
- Selected MW Class of Offshore Wind Turbines in the Market
- Top 10 Suppliers: 2013
- Five Next Suppliers in Line: 2013
- Leading Suppliers in Top 10 Markets: 2013
- Share of Supplied MW by Top 10 Wind Turbine Suppliers
- Market Shares: 2011-2013
- Wind Turbine Size Classes by Market Share: 2011-2013
- Wind Turbine Size Classes by Market Share: 2013
- Leading Suppliers in the Four Wind Turbine Size Classes: 2013
- Leading Suppliers in the 1.5-Plus Megawatt Size Class: 2013
- Leading Suppliers in the Multi-Megawatt Size Class: 2013
- Leading Utility and IPP Wind Farm Owner-Operators
- Potential Major Wind Farm Owner-Operators/Developers
- Forecast for Global Wind Power Development: 2014-2018
- Forecast for Wind Power Development, American Continent: 2014-2018
- Forecast for Wind Power Development, Asia: 2014-2018
- Forecast for Wind Power Development, Rest of World: 2014-2018
- Forecast for Wind Power Development, Europe: 2014-2018
- Offshore Wind Power Development: 2014-2018
- Wind Force 12 Actual Development
- Renewable Energy Targets for EU States under the 20% by 2020 Policy
- Penetration Rate of Wind Power in Select Countries
- Estimate of Electricity from 2013 Wind Power Capacity by Country
- Growth of Wind Power Compared to Worldwide Electricity Generation
- Contribution of Wind Power to Worldwide Electricity Generation
- Wind Incentives in Select Countries
- Selected OEMs Offering O&M Services
- Selected Independent Service Providers and Specialties
- Core Strategy Focus of Different Types of Owner
- Disadvantages and Advantag