
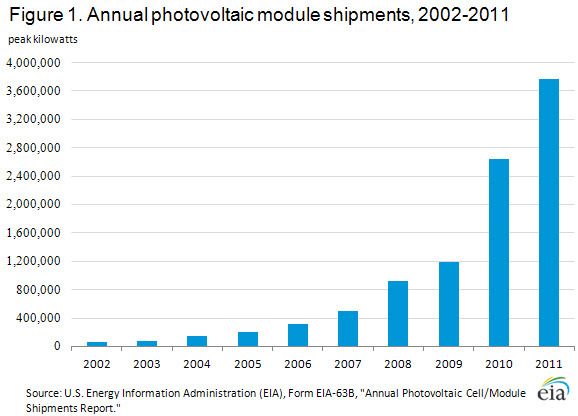
Total U.S. shipments of photovoltaic modules increased from 2, 644,498 peak kilowatts in 2010 to 3,772,075 peak kilowatts in 2011, a nearly 43-percent surge, according to the report by the U.S. Energy Information Administration.
U.S. shipments of solar photovoltaic modules reached a record high last year, despite declining prices for solar technology and photovoltaic cells, according to a report issued Wednesday.
The number of companies moving photovoltaic modules or cells, including manufacturers, importers and exporters, also grew 7 percent to 120 over the year.
The growth was spurred, in part, by declining photovoltaic cell and module prices as well as by the expiration of the government’s grand program for the industry, according to the report.
The solar industry rushed to construct projects by the end of 2011 as the deadline for a government grant program drew near, the report said.

The declining price led to bankruptcies among U.S. solar companies, including the high-profile collapse of Solyndra. As a result of the financial difficulties, employment in photovoltaic- related jobs dropped nearly 10 percent to 15,777 full-time equivalent positions, according to the report.

The U.S. solar photovoltaic (PV) industry continued its strong growth in 2011, despite the obstacles of an increasingly tough price-competitive marketplace, bankruptcies, and closings of several solar manufacturers. Total shipments of PV modules in 2011 hit a record high, increasing from 2,644,498 peak kilowatts (kWdc1 peak) in 2010 to 3,772,075 peak kilowatts (Figure 1 and Table 3).
![]()
This represents a nearly 43-percent increase from 2010. Growth was spurred, in part, by declining PV cell and module prices (Figure 2 and Table 4) caused by competitive pressures.

The solar Investment Tax Credit (ITC), and the 1603 Treasury Program 2 in particular, which was set to expire on December 31, 2011, also supported this growth. Consequently, the solar industry rushed to construct projects by the end of 2011 as the deadline for the grant program drew near.
Industry status
In 2011, there were 120 companies, comprising PV manufacturers, importers and exporters, reporting shipments of PV cells and modules (Table 1). This marks an increase of 7 percent from the 112 companies reporting shipments in 2010.
Many of the companies reporting PV shipments in 2011 also reported being involved in one or more of the following photovoltaic-related activities (Table 1):
- 63 companies were involved in module and/or cell manufacturing.
- 57 designed modules or systems.
- 35 developed prototype modules.
- 22 developed prototype systems.
- 65 were involved in wholesale distribution.
- 29 were involved in retail distribution.
- 32 installed PV systems.
In addition, several manufacturers are planning to introduce new photovoltaic-related technical products in the next calendar year (Table 1):
- 22 plan to introduce new single-crystal silicon modules.
- 17 plan to introduce new cast silicon modules.
- 14 plan to introduce new thin-film modules.
- 5 plan to introduce new concentrator photovoltaic modules.
Of the 120 companies, 97 had 90 percent or more of their companywide revenues in photovoltaic-related activities, 6 had 50 to 89 percent, 3 had 10 to 49 percent, and 14 had less than 10 percent (Table 1).
Employment in PV-related activities reported on the EIA-63B survey decreased nearly 10 percent, from 17,487 full-time equivalent (FTE) 3 employees in 2010 to 15,777 FTE in 2011.
Based on company reports, 75 companies had no change in or higher employment employment levels, while 45 companies, including several that are no longer in business, had decreases. Note that the EIA-63B survey does not cover all segments of the solar PV industry, such as most installers.
Value, average price, and average efficiency
In 2011, the value of photovoltaic cell shipments totaled nearly $1.7 billion and the value of photovoltaic module shipments reached nearly $6 billon (Table 2). Value includes charges for cooperative advertising and warranties, but does not include excise taxes and the cost of freight or transportation.
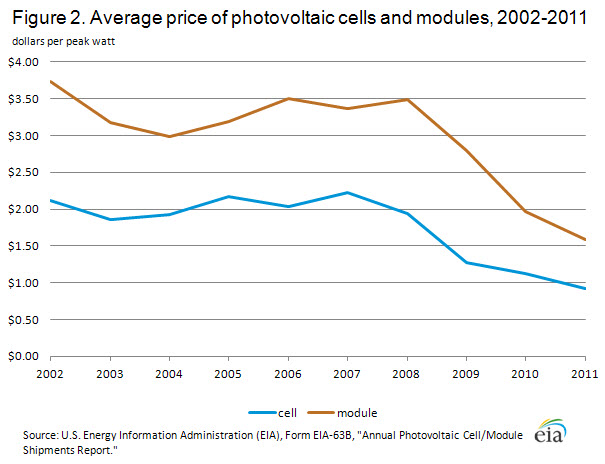
Average prices of photovoltaic cells and modules per peak watt of capacity shipped have declined steady over the past several years. For photovoltaic cells, the average price has decreased more than 18 percent, from $1.13 in 2010 to $0.92 in 2011, and the average price of photovoltaic modules fell nearly 19 percent, from $1.96 in 2010 to $1.59 in 2011(Figure 2 and Table 4).
The performance of a photovoltaic module is typically measured in terms of its energy conversion efficiency, i.e., the percentage of incident solar energy (input) that the module converts to electricity (output) under standard rating conditions. In 2011, the average energy conversion efficiencies reported by manufacturers and imports were as follows (Table 2):
- 16 percent for Crystalline Silicon PV module.
- 11 percent for Thin-film PV module.
- 29 percent for Concentrator PV module.
U.S. manufactured
In 2011, 1,161,589 peak kilowatts of PV modules were manufactured in the United States. This is 9 percent more than in 2010. Manufacturers in California, Ohio, Oregon, and Tennessee produced almost 75 percent of the domestically manufactured PV modules (Table 7). Crystalline silicon accounted for more than 64 percent of the annual domestically manufactured PV modules, followed by thin-film modules with nearly 32 percent. Together, crystalline silicon and thin-film accounted for more than 96 percent of all PV manufacturing.
Imports
Imports of PV modules shipments totaled 3,323,865 peak kilowatts in 2011. The predominant type of import shipment was crystalline silicon modules, accounting for nearly 81 percent (2,678,848 peak kilowatts) of total imports. China (51 percent), the Philippines (21 percent), and Malaysia (16 percent) accounted for about 88 percent of total import shipments (Table 8).
Exports
Exports of PV module shipments totaled 793,939 peak kilowatts in 2011, accounting for about 21 percent of total shipments, or approximately 24 percent of PV module imports. The predominant type of export shipment was crystalline silicon modules, accounting for nearly 68 percent (538,370 peak kilowatts) of total exports. PV module shipments to Germany (19.8 percent), Canada (19.6 percent), and Italy (18.5 percent) accounted for largest shares of the export market (Table 9).
U.S. shipments
Shipment by geography
U.S. PV module shipments totaled 2,927,076 peak kilowatts in 2011. The shipments went to all 50 States, the District of Columbia, American Samoa, Guam, Puerto Rico, and the Virgin Islands (Table 10).
More than 67 percent of U.S. PV module shipments (1,967,257 peak kilowatts) went to five States (in order of decreasing volume): California, New Jersey, Arizona, Colorado, and Texas. More than 50 percent (1,488,933 peak kilowatts) of domestic shipments went to California (36 percent) and New Jersey (14 percent).
Shipments by sector
U.S. PV module shipments to the commercial sector in 2011 accounted for 1,399,047 peak kilowatts, nearly 48 percent of the domestic market. Of the domestic shipments to the commercial sector, approximately 96 percent was crystalline silicon, about 3.5 percent was thin-film PV, and slightly more than 0.1 percent was concentrator PV (Table 11).
The electric power sector was the second-largest domestic market in 2011, accounting for 761,085 peak kilowatts, or 26 percent of the domestic market share. Crystalline silicon accounted for 83 percent of the electric power shipments, thin-film accounted for more than 11 percent, and concentrator accounted for nearly 6 percent.
Shipments to the residential sector amounted to 754,212 peak kilowatts, or nearly 26 percent of the domestic market share. About 95 percent of the shipments were crystalline silicon and close to 5 percent was thin-film.
The industrial sector, with about 0.4 percent of domestic shipments, was the smallest domestic sales market, totaling 12,732 peak kilowatts. More than 85 percent of the shipments was crystalline silicon, 0.02 percent was thin-film, and close to 15 percent was concentrator.
Shipments by grid or off-grid
U.S. PV module shipments to grid-connected distributed PV systems in 2011 accounted for 2,152,947 peak kilowatts, or nearly 74 percent of the domestic market. Of the domestic shipments to grid-connected distributed PV systems, 96 percent was crystalline silicon, nearly 4 percent was thin-film, and less than 0.2 percent was concentrator (Table 12).
U.S. PV module shipments to grid-connected centralized PV systems were the second-largest domestic market in 2011, accounting for 761,085 peak kilowatts, or 26 percent of the domestic market share. Nearly 83 percent of shipments was crystalline silicon, 11 percent was thin-film, and 6 percent was concentrator.
PV module shipments to off-grid domestic PV systems such as households and communities not connected to the utility grid amounted to 7,656 peak kilowatts, or less than 0.3 percent of the domestic market share. More than 95 percent of total domestic shipments was crystalline silicon, slightly more than 1 percent was thin-film, and nearly 4 percent was concentrator.
Other off-grid non-domestic PV systems such as water pumping, remote communications, safety and protection devices, at locations without the presence of the utility grid, accounted for less than 0.2 percent of domestic shipments. This was the smallest domestic end-use market, totaling 5,369 peak kilowatts. More than 64 percent was crystalline silicon and nearly 36 percent was thin-film.
Inventory
In 2011, U.S. inventories of PV modules at yearend totaled 1,163,848 kilowatts (Table 6). This is 205 percent, or 782,659 peak kilowatts, higher than the yearend inventories of the previous year (381,189 peak kilowatts). Compared with industrial output, this was 2,259 peak kilowatts more than the 1,161,589 peak kilowatts of PV modules manufactured in the United States during the year.
Endnotes:
1 DC stands for direct current, the type of power output by photovoltaic cells and modules. All capacity values in this report are in DC terms.
2 The 1603 Treasury Program is a federal grant program that gives solar and other renewable energy projects developers a direct cash grant in lieu of the Section 48 Investment Tax Credit (ITC). Applicants are eligible for a 1603 payment only if they commenced construction on projects by December 31, 2011 and complete construction by December 31, 2016.
3Full-time equivalent is a unit measure of the number of employees on full-time schedules plus the number of employees on part-time schedules converted to a full-time basis.
http://www.eia.gov/renewable/annual/solar_photo/