It is one thing to install generation capacity and another to take advantage of that energy. For that, we have to look at the electrical demand covered by wind energy. To do this, we will have graph 1 where the countries are classified based on the use of the wind energy generated.
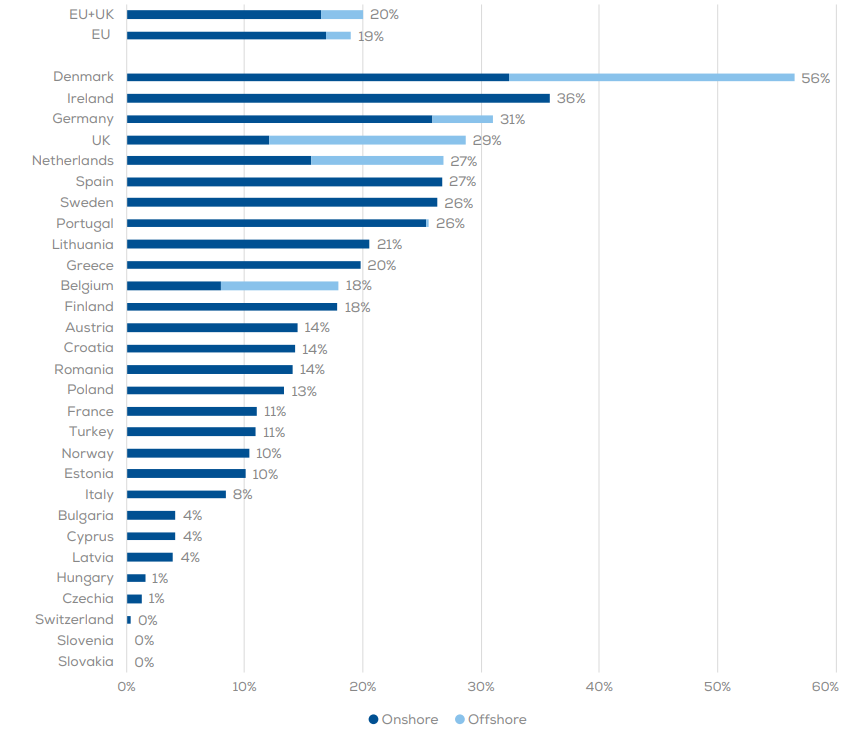
1.Image.- Percentage of electricity demand covered by wind energy in 2023.
In this section, Denmark is the absolute leader with more than 56% of the energy consumed. Largely due to the penetration of the offshore wind turbines.
The silver medal goes to Ireland with 36%, solely relying on onshore wind power. Bronze goes to Germany which saw its demand share jump from 26% in 2022 to 31% in 2023, overtaking the UK to end up with the third largest share in Europe. We have to highlight Germany, which is the most populated country in the European Union, which makes it even more commendable that 31% of all energy consumed comes from wind power.The UK was the non-EU country with the highest share of wind power at 29%, placing it fourth in Europe. Followed by the Netherlands (27%), Spain (27%), Sweden (26%) and Portugal (26%).
20 countries had wind energy energy quotas of at least 10%, 17 in the EU plus the United Kingdom, Turkey and Norway, the case of Slovenia and Slovakia being very curious.
Capacity factors
The capacity factor is the ratio between the energy produced by a plant and what it could produce if it operated all the time at maximum power. Being a very important piece of information when building the business model.
Capacity factors for the entire EU wind fleet were on average 25%. For onshore wind farms they were 24% (equal to 2022), while for offshore wind farms they were 34%, compared to 35% in 2022.
They use larger blades and relatively lower wind turbines, which increases their capacity factors.
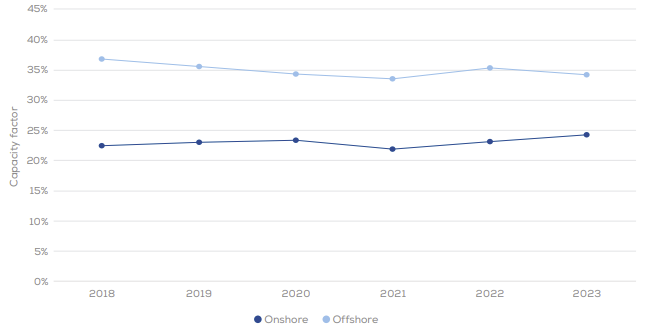
2.Image.- Average capacity factor of wind turbines installed in the EU, 2018-23. (Source: WindEurope – Wind energy in Europe – 2023).
The fleet-wide capacity factor figures are relatively low compared to new wind farms, as they represent the performance of the entire wind farm, including very old installations.
These older facilities typically have turbines with large wind turbines and relatively small rotors (short blades). These are best suited for windy locations. Modern turbines can be built in locations with a lower high-speed wind resource and therefore must take advantage of lower wind speeds.
Capacity factors for new onshore wind farms are estimated to be between 30 and 35%. For new offshore wind farms, this figure ranges between 42% and 55%. Therefore, in the coming years, load factors are expected to increase considerably.
AGING OF EUROPEAN WIND FARM
As the European wind turbine fleet ages, we expect repowering volumes to increase. But as long as energy prices are higher than expected, the economic situation will continue to favor extending the useful life of wind turbines.
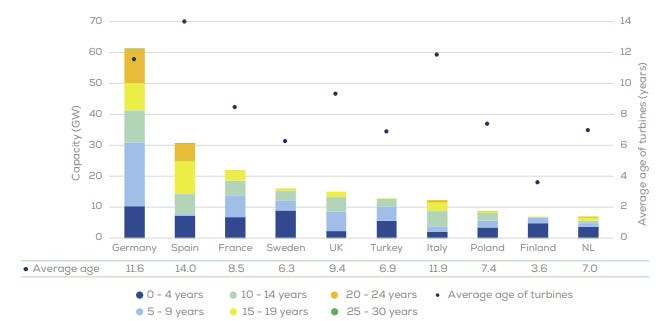
3.Image.- Average age of onshore wind farms in Europe. (Source: WindEurope – Wind energy in Europe – 2023).
Many of Europe’s onshore wind farms are approaching the end of their planned operational lives. In fact, currently, 22 GW of existing wind farms in Europe have already been in operation for more than 20 years. On the other hand, by 2030, the power will be 52 GW.
As you can see in the previous infographic, Germany has the largest potentially repowerable installed capacity, with almost 20 GW that is more than 15 years old.
In Spain, on average, the age of the turbines amounts to 14 years, one of the highest in Europe.
The majority of wind farms reaching the end of their useful life currently opt for some form of life extension, not only due to the current economic situation, but often because legislative frameworks for repowering do not yet exist.
Repowering wind farms triples their production on average, while reducing the number of turbines.
Therefore, this situation presents a unique opportunity to rapidly increase wind energy production in Europe. It should be noted that almost all of the repowered capacity between now and 2030 will come from onshore wind energy.
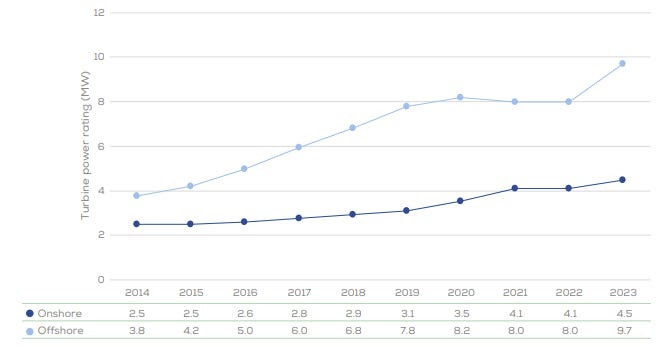
4.Image.-Average power of turbines installed in Europe, 2014-23. (Source: WindEurope – Wind energy in Europe – 2023).
Furthermore, the benefit is double, since, as can be seen in the following graph, the trend is very clear. The nominal power of each wind turbine has increased steadily. In 2014, onshore, the power was 2.5 MW, and last year it was 4.5 MW, and in wind turbines destined for the sea the power has doubled in the last decade, approaching 10 MW per unit.
In addition to newer, more powerful machines, turbines with relatively larger rotor diameters and lower power ratings were introduced in 2022. They are designed for locations characterized by lower wind speeds. Their onshore deployment in the coming years is likely to further increase the average power of installed onshore wind turbines.
Likewise, it can also be seen how the nominal power of the offshore wind turbines (9.7 MW) doubles the capacity installed on land (4.5 MW).
Exceptional case of Ukraine
In recent days it has been reported in the media how Russia has bombed energy facilities in Ukraine, including the turbines of the hydroelectric plant built on the dam in Dnipro or the connection lines with the Zaporizhia nuclear power plant. Throughout history it has been very common to cut off the adversary’s energy supplies to maximize the damage produced in enemy territory. Because in a war all available means are used to defeat the enemy and impose one’s own conditions unconditionally.
Well, when it comes to the wind sector, Ukraine managed to build new wind capacity (146 MW) despite the ongoing war. At the same time, however, 71% of the country’s 1.9 GW capacity was offline (but not destroyed) by the end of 2023.