The objective of this research is to investigate the implementation of two concentrated solar power (CSP) technologies in the 28 devoted locations in Egypt, in order to select the optimum site-specific CSP technology. This may be achieved by a validated thermo-economic simulation of power plants using the Sam advisory model and an investigation of the two proposed CSP technologies’ configurations to fulfill the power plant’s thermal demand. Simulations take into consideration the environmental, technical, financial, and economic aspects of the projects. Among many simulated parameters, three are considered to compare the two proposed technologies’ configurations in the 28 locations utilizing geographic information system aid. Those parameters are the annual power production, the levelized cost of energy, and water consumption. A comparative analysis indicated that the solar tower requires 25% more land than the parabolic trough. The additional collecting area raised the net capital cost of the solar tower system by 15% over the parabolic trough model. As a result, the solar tower arrangement reduces the levelized cost of energy while increasing the yearly power generated and water required by the power plant. Simulation results favored the proposed solar tower configuration over the parabolic trough and recommended the implementation of such concentrated solar power projects in the central and eastern locations of Egypt.

Introduction
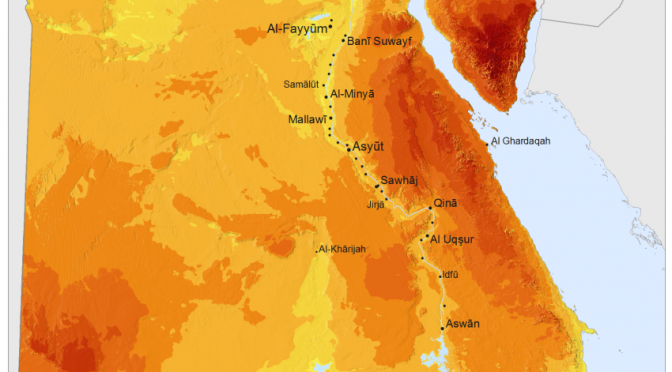
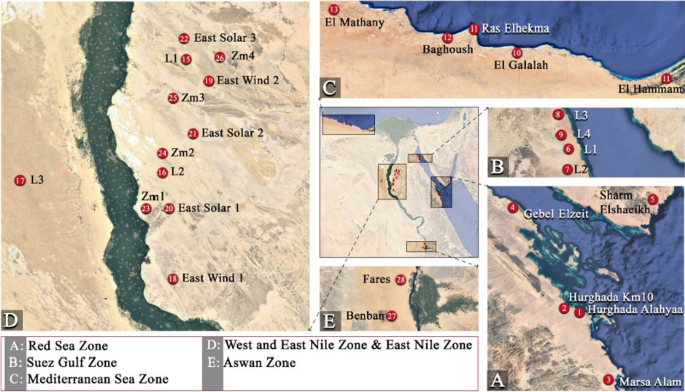
One of the world’s most pressing concerns is satisfying the rising energy demands in an eco-friendly and sustainable manner (Dincer and Acar 2015), especially in progressively developing countries with booming populations like Egypt. In this respect, the provision of renewable energy options is a must. Egypt’s Vision 2030 focuses on sustainable development in the country and considers energy to be the second most important pillar of the ten pillars of sustainable development (https://mped.gov.eg/EgyptVision?lang=en). The vision report emphasizes the optimum and domestic usage of energy resources as well as the diversification of the energy supply mix to incorporate renewable energy to produce electricity. Moreover, the report emphasizes mitigation of carbon dioxide emissions from the energy sector. Consequently, a presidential decree was issued in 2016 for devoting 28 locations (http://nrea.gov.eg/test/en/Home), which are categorized into 6 major zones, to be developed through renewable energy projects by the New and Renewable Energy Authority (NREA) and Ministry of Electricity and Renewable Energy, as shown in Fig. 1 (Moharram et al. 2022).
The most abundant renewable energy resource in Egypt is solar energy (Aliyu et al. 2018). Much of the emphasis on renewable energy is therefore targeted at the optimal and site-specific solar energy technologies to be implemented. There is a potential to reduce greenhouse gas (GHG) emissions in Egypt by 80–95% by following the Middle East and North Africa (MENA) Energy Policy Plan, which seeks to reduce climate change by capping the global temperature rise to no more than 2 °C (Menichetti et al. 2018; Elshafey et al. 2018). The integration of concentrated solar power (CSP) technologies with already existing thermal (fossil) power plants presents one of the low carbon energy technology solutions that may be adopted (Cioccolanti et al. 2019). Although CSP has a relatively large number of independent elements, making it a complex technology, this limitation is counterweighted by the fact that the technology provides application flexibility to suit demand. The conversion to thermal energy distinguishes CSP from the other main renewable energy technologies, such as hydropower, wind power, and photovoltaic cells (PV). Additionally, CSP is particularly appealing due to its advantages in terms of high efficiency, low operating costs, and good scale-up potential (Zhang et al. 2013). The selection of the site for the construction of a CSP power plant is subject to certain important conditions that must be met in order to ensure the economic output of electricity. The NREA has considered these criteria during the selection of the 28 locations and verified the feasibility of implementing CSP technologies. General site requirements are as follows:
- Annual Direct Normal Irradiation (DNI) should be greater than 1900 kWh/m2 (Zhao et al. 2009).
- Flat land area with an overall slope of less than 1–3% (Yang et al. 2010), as the intensity of solar radiation is essentially controlled by the ground slope at a certain location (Allen et al. 2006). Due to various parameters such as self-shadowing and shading cast by surrounding terrain, the amount of radiation intercepted by the collectors is significantly reduced. As a result, land with a steeper slope has an impact on solar plant productivity.
- The wind speed should be less than 15.64 m/s in order to decrease the stresses applied to the support structure of the solar collector assembly (Shahrukh Saleem and ul Asar 2021).
- Availability of accessible grid connections if the CSP project is not designed to fulfill a specific local (site) demand for industrial applications.
- Availability of water resources, as the large amount of water consumed in the cooling towers is one of the disadvantages of CSP for power generation.
- The availability of good transportation facilities is a socio-economic aspect that should be considered in developing remote areas where CSP projects are usually built.
- Consideration of protected areas, wildlife traffic, and agriculture.
- Availability of a backup fuel supply.
Concentrated solar power (CSP) technologies
When considering harnessing solar energy, there are four main CSP technologies used: a Parabolic Trough Collector (PTC), a Central Solar Tower (CST), a Linear Fresnel Reflector (LFR) and a parabolic dish (Fernández et al. 2019; Hayat et al. 2019). Concentrated solar power plants are gaining increasing interest, mostly by using the parabolic trough collector system (PTC), although solar power towers are progressively occupying a significant market position due to their advantages in terms of higher efficiency, lower operating costs, and good scale-up potential.
A PTC plant consists of a group of reflectors that are curved in one dimension in a parabolic shape to focus direct solar radiation along an absorber tube that is mounted in the focal line of the parabola. In order to prevent heat loss to the ambient air, the absorber tube is enveloped by an evacuated glass tube. The reflectors and the absorber tubes move in tandem with the sun using a linear axis tracking mechanism from sunrise to sunset (Zhang et al. 2013). On the other hand, CST systems utilize a large field of mirrors implemented with a solar tracking mechanism on two axes, referred to as heliostats. The sunlight is focused at the top of the tower into the cavity of the central receiver (Gadalla and Saghafifar 2018), where the concentrated solar energy is absorbed by the circulating working fluid, converting the solar energy into thermal energy (Shatnawi et al. 2019).
Several recent studies have been conducted discussing the main features, operating principles, advantages, and challenges associated with PTC and CST systems, as evident in Table 1. Although CST plants are undeniably less widespread than PTC plants, there is an open debate in the literature about which CSP technology may have the best blooming prospects (Boretti et al. 2019). Taking into account the degree of maturity, the ease of implementation, and the literature reviews performed by researchers, PTCs represent a competitive technology supplying an adequate amount of heat to run conventional steam power plants in Egypt (Moharram et al. 2021a).Table 1 Contributions of previous research on concentrated solar power systems
Contributions of previous research on concentrated solar power systems.
Multi-criteria decision making for optimum site and technology selection
When contemplating CSP deployment, it is worth noting that very few of the previously conducted studies have integrated location and technology selections in order to attain a decision-making strategy for the optimum selection, as shown in Table 2.Table 2 Contributions of previous research on simulation techniques for optimum site and technology selection
Contributions of previous research on simulation techniques for optimum site and technology selection.
Few studies investigated CSP technology, which relied mostly on parabolic trough collectors, while the others concentrated only on PV technology. Based on the objectives of each assessment and the selected strategy for addressing the problem, it may be argued that various investigations employed distinct methodologies and assumptions based on the governmental objectives in each location. There does not appear to be a comprehensive study in the literature that combines the levelized cost of energy, power productivity, and environmental impact for two distinct CSP technologies (PTC and CST) in a decision-making approach that takes into account the distinct local resources and geographical characteristics of different sites.
The novelty of this study is the development of a prediction tool using SAM software to anticipate the performance of concentrated solar power plants in Egypt. The two most mature CSP technologies (PTC and CST) are examined to determine the ideal choice to implement in several locations with favorable weather conditions, taking into consideration minimal environmental impact, cost efficiency, and high power productivity. Consequently, this signifies the feasibility and reliability of employing CSP plants to operate in Egypt, replacing conventional steam power plants, taking into account the site meteorological data, component benchmarks, and local financing and taxing regulations. Moreover, the proposed model is developed to aid the government’s strategic plans targeting sustainable development in Egypt.
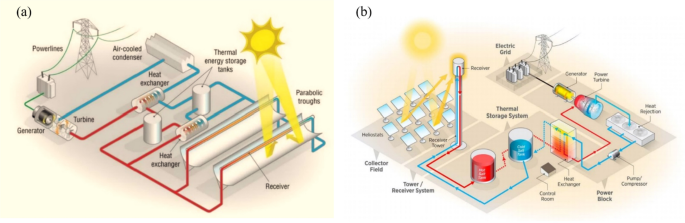
Materials and methods
From the previous review, more attention has been focused on the implementation of solar thermal power plants in Egypt, utilizing various CSP technologies at different locations. Illustrated in Fig. 2 are the schematic diagrams of the two proposed configurations under investigation in this study, employing parabolic trough collectors and central solar tower technologies, respectively (Csp Models and System Advisor Model 2021). The proposed plant can be disassembled into three main components. Firstly, the solar field acts as the heat source for the plant, whether by utilizing PTC or CST. Secondly, thermal energy storage tanks are mandatory in order to meet the plant’s thermal demand during low solar irradiance periods and at night. The third component is the steam Rankine cycle, consisting of the heat exchanger, steam turbine, generator, and condenser.
The output forecasts and financial projections for CSP plants can now be made using a variety of free tools designed for fast measurements, such as “Greenius,” developed by the Institute of Solar Research, or System Advisor Model (SAM), developed by NREL and distributed as a free software platform for forecasting the hourly and sub-hourly energy output of various renewable energy sources (Polo et al. 2017; Blair et al. 2014). As a consequence of SAM’s versatility and capacities, it is becoming a basic method for the performance evaluation of CSP and PV plants in many studies (Avila-Marin et al. 2013; Vasallo and Bravo 2016; Bishoyi and Sudhakar 2017). In the research reported herein, two SAM simulations of a 115 MW CSP plant have been performed in the areas under investigation, utilizing parabolic trough and solar tower technologies individually. The input parameters will be presented in this section and may be classified as environmental, financial, and economic data.
Environmental data
Solar radiation data availability is essential, along with other data, for the simulation of any CSP project. Hourly DNI and GHI values for a specific location in a standard format, most commonly TMY3 (Typical Meteorological Year version 3), are necessary to be used for any software (Cebecauer and Suri 2015). Some of the sources of the datasets are presented in Table 3. Mandatory solar, wind, and ambient (meteorological) data over a time period of two decades have been collected from the Meteonorm database (https://meteonorm.com/en/meteonorm-parameter).Table 3 Environmental data sources
Technical data
The terminologies solar multiple (SM) and Equivalent Full Load Storage Hours (EFLSH), which are widely used to express the basic configuration of CSP plants, are applied. The SM is the proportion of the solar field’s yield at design conditions to the nominal turbine power, while the EFLSH represents the ratio between design storage capacity and nominal turbine capacity. The proposed parabolic trough collector and solar tower power plants’ input design parameters are presented in Table 4. The primary designs were based on SAM default data, then modifications were applied, such as the selection of collectors, receiver tubes, power plants and other parameters aiming to lower LCOE and water consumption.Table 4 Parabolic trough and central solar tower plants design input parameters
Financial data
The main financial input parameters are summarized in Table 5. A common interest rate of 3.0%/year has been selected (soft loan). Moreover, the debt period and operational plant life are assumed to be 18 and 25 years, respectively.Table 5 Financial input parameters (https://www.cbe.org.eg/en/Pages/default.aspx)
Economic data
In order to determine whether the proposed plant is practical and cost-effective, an economic evaluation is essential to assess the plant in comparison with conventional alternatives. An overview of parabolic trough and solar tower investment and operational costs is presented in Table 6 based on SAM default values, collected data from similar recent projects, and local benchmarks.Table 6 Economic input parameters (https://sam.nrel.gov/sites/sam.nrel.gov/files/content/case_studies/sam_case_csp_physical_trough_andasol-1_2013-1-15.pdf)
Model validation
The System Advisor Model (SAM) software has been extensively validated against experimental data for concentrated solar power energy facilities by Boretti et al. (2020). Their validation was based on data from the 250 MW parabolic trough facilities of Genesis, Mojave, and Solana, and the 110 MW solar tower facility of Crescent Dunes in the USA, concluding that SAM can be considered a reliable tool to model CSP technologies. Moreover, both solar fields (PTC and CST) presented in this paper have been validated against the following basic mathematical models.
Parabolic trough collector mathematical model
The following mathematical model presented by Moharram et al. (2021b) for modeling parabolic trough collectors has been utilized to validate the results obtained from the solar field in the proposed model.
The instantaneous efficiency of parabolic trough collectors can be calculated from its characteristic curve for the Euro-trough model using Eq. 1. Consequently, the amount of heat gained can be deducted as shown in Eq. 2.
?PTC=0.75?4.5×10?5(Tcol?Tamb)?0.039(Tcol?TambG)?3×10?4×G(Tcol?TambG)2
(1)
Q=Afield×?PTC×G
(2)
The parabolic trough area can be deduced using Eq. 3 by means of the benchmark standards for collector width and glass envelope diameter.
APTC=LPTC×(Wcol?Denv)
(3)
Moreover, by assigning the collector mass flow rate and the hydraulic mass flow rate as input parameters, the number of loops, loop area, loop width, and the number of parabolic trough collectors are then calculated using Eqs. 4–7, respectively.
Nloop=m.colm.hyd
(4)
Aloop=APTCNloop
(5)
Wloop=AloopLm
(6)
NPTCs=APTCLm×(Wcol?Denv)
(7)
The total pressure losses are subsequently calculated based on major and minor losses along the field length. The general loss equation is presented in Eq. 8.
Ptloss=Nloop×?Ploop
(8)
Central solar tower mathematical model
The mathematical model for CST presented in the following section was used to anticipate the basic output performance parameters required to validate the data obtained using SAM software. The heliostat field is the costliest component when considering the implementation of CSTs; therefore, the heliostats should be carefully allocated in the field to obtain the maximum efficiency. Thus, solar field efficiency is deduced using Eq. 9 (Moukhtar et al. 2021). Consequently, the amount of thermal energy available can be obtained using Eq. 10 (Reddy et al. 2014).
?field=?refl×?att×?cos×?sh&bl
(9)
Q=Afield×?field×G
(10)
The cavity top temperature is calculated based on the cavity effectiveness relation between receiver temperature and inlet and outlet temperatures as expressed in Eq. 11.
Trec=(To?Ti?cav)+Ti
(11)
Validation results
The validation procedure was conducted by using variable solar intensities in order to measure the output thermal energy available from both CSP technologies. Similar input parameters and climatic data were processed using SAM software and compared to the results obtained using MATLAB software to solve the mathematical model of each solar field. Preliminary results considering output thermal energy were computed using both models, yielding a standard error of 2.38% and 3.62% for the PTC model and CST model, respectively. Moreover, SAM validation was performed on two CSP reference plants in Spain: Andasol-1 as a parabolic trough and Gemasolar as a solar molten-salt tower plant. For Andasol-1 and Gemasolar, the annual production uncertainty was 2.6% and 2.4%, respectively (https://sam.nrel.gov/sites/sam.nrel.gov/files/content/case_studies/sam_case_csp_physical_trough_andasol-1_2013-1-15.pdf).
Results and discussion
A comparative study was conducted for the two proposed configurations previously described, yielding a performance assessment for the 28 different locations of implementation. Taking into consideration the conversion efficiency of both collectors, together with the effective operating hours governing the thermal storage capacity for both technologies, the calculated land area required for the solar tower is higher than the parabolic trough area by 25%. This increase in collectors’ area increased the net capital cost of the solar tower configuration over the parabolic trough net capital cost by 15%. On the other hand, the annual power produced and the water consumed by the power plant with the solar tower configuration are approximately 20% higher than those of the same power plant with the parabolic trough collectors configuration; thus, a reduction in the levelized cost of energy is denoted in the case of the solar tower, however, concerns regarding environmental impacts arise. Among many simulated parameters, only three major factors have been considered to evaluate the two proposed configurations with GIS aid. Those parameters are the annual power production, water consumption, and LCOE, which are presented in Table 7.Table 7 PTC and CST simulation results for the 28 locations devoted to renewable energy projects
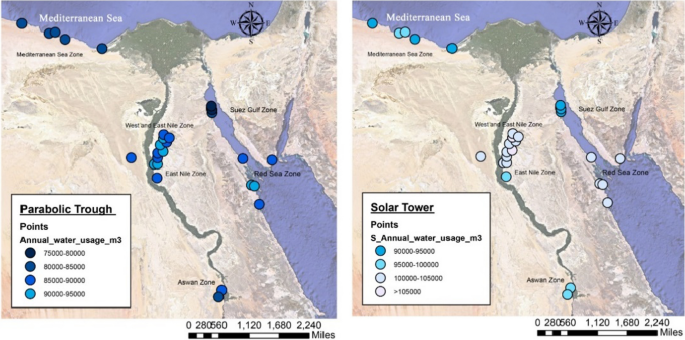
In addition to the results illustrated in Fig. 3, the GIS maps visualized in Figs. 4, 5, and 6 reveal that the water consumption of plants located in the northern zones (Mediterranean and Suez Gulf) is less compared to those in the central, eastern, and southern zones, respectively, for both technologies’ configurations. Moreover, the LCOE has been driven by the estimated annual power production. The lowest levelized cost of energy is achievable in the central zones, followed by the eastern and southern zones, respectively. Finally, the highest LCOE is in the northern zones for both technologies’ configurations.

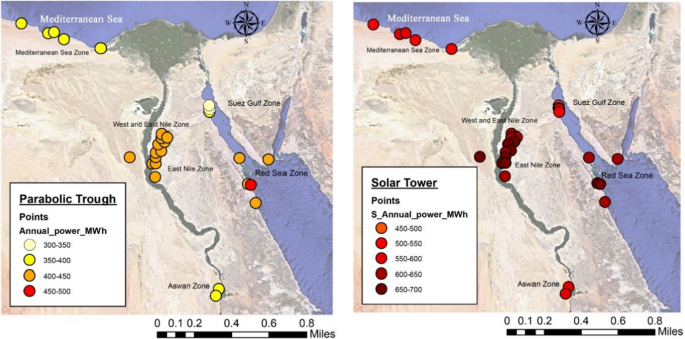
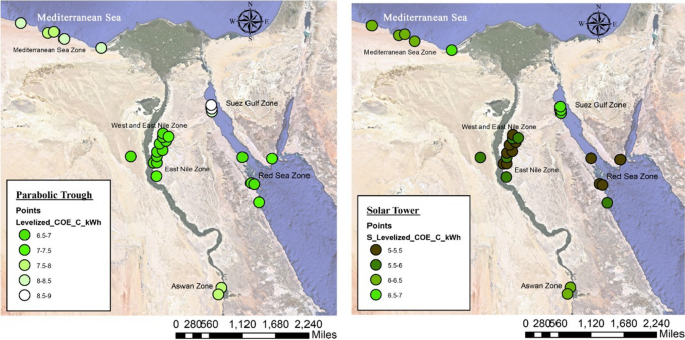
The annual power produced by the plants located in the central zone (Nile zones) is higher than plants in the southern region (Aswan), eastern zone (Red Sea), and northern zones (the Mediterranean Sea and Suez Gulf), respectively. The results obtained comply with the operational nature of steam power plants in hot, arid regions, as the water that is used to cool down the power block consequently has a high temperature, reducing production and efficiency (Hoffmann et al. 2013). The eastern zone showed promising results close to the central zones, having a high annual power production together with an adequate amount of water consumption and a low LCOE, unlike the northern zone results for both technologies’ configurations, as illustrated in Fig. 7. It is worth mentioning that parts of the southern locations have been selected for PV projects that are already installed, such as the Benban PV power plant (Mohamed and Maghrabie 2022), and parts of the northern locations have been selected for wind projects that are already in operation, such as the Zaafarana and Gabal Elzeit wind farms (Aliyu et al. 2018).
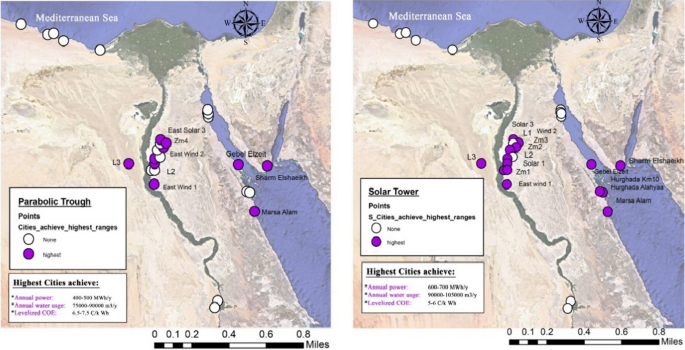
In summary, the parametric study demonstrates that the eastern regions are the most suitable location for implementing both proposed configurations. However, the results reveal that the central solar tower (CST) generates a significantly higher annual power output compared to the parabolic trough collector (PTC) configuration, which is consistent with the findings reported by Amani et al. (2022). Nonetheless, the results of the proposed model are in agreement with research conducted by Ahmad and Zeeshan (2023), declaring that the use of CST results in greater water consumption, making the decision to use CST dependent on water availability in the region. Additionally, the GIS maps presented in Fig. 6 provide valuable information to the New and Renewable Energy Authority (NREA) and the Ministry of Electricity and Renewable Energy in Egypt, allowing them to make informed decisions regarding site and technology selection for renewable energy projects in the 28 locations earmarked for sustainable development.
Conclusion and prospects
A thermo-economic model has been established using SAM software to investigate the feasibility of implementing concentrated solar power plants in various locations in Egypt. Two proposed models were examined to indicate the optimum site-specific CSP technology to be employed in each location devoted to renewable energy development in Egypt. Moreover, a comparative study was conducted on an annual basis between the three major parameters affecting decision-making when considering implementation, which are power productivity, water consumption, and the LCOE. The Geographical Information System was used to illustrate the results from the 28 locations in order to establish a strategic planning guide for Egypt’s sustainable development. The key findings from the simulations were as follows:
- The solar tower configuration requires 25% more land than the parabolic trough configuration. This increase in collector area elevated the solar tower’s net capital cost by 15% above the parabolic trough.
- For both technologies, plants in the northern zones (Mediterranean and Suez Gulf) consume less water than those in the central, eastern, and southern zones.
- Plants implemented in the central zone (Nile zones) generate more annual electricity output than plants in the southern region (Aswan), eastern zone (Red Sea), and northern zone (Mediterranean Sea and Suez Gulf), respectively.
- According to the parametric analysis, the eastern zones have been shown to be an advantageous area for implementing both indicated technologies.
In conclusion, setting up a prediction tool that anticipates the amount of energy available in different locations has the capability of providing Egypt with an environmentally friendly renewable energy source, encouraging the rapid urban expansion of sustainable cities.
Despite the fact that power productivity, water consumption, and LCOE are considered reliable parameters in order to select the optimum site-specific CSP technology, further research is recommended to investigate the results presented using several sustainability assessment tools, including exergo-economic and exergo-environmental approaches, as elaborated in recent studies conducted by Rahnama et al. (2019), Aghbashlo et al. (2020). Furthermore, setting a deterministic analysis can pave the way for adding supplementary modifications to the proposed models. For instance, Moharram et al. (2021a; b) investigated cogeneration hybrid plants that can produce power and fresh water simultaneously.
Availability of data and materials
Not applicable.
Abbreviations
A : Area, m2 G : Solar irradiance, W/m2 N : Number P : Pressure, bar Q : Thermal power, W T : Temperature, °C W : Width, m CSP: Concentrated solar power CST: Central solar tower DNI: Direct normal irradiation EFLSH: Equivalent full load storage hours EPC: Engineering, procurement, and construction GHG: Greenhouse gas GHI: Global horizontal irradiance GIS: Geographic information system HTF: Heat transfer fluid IRR: Internal rate of return LCOE: Levelized cost of energy LEC: Levelized energy cost LFR: Linear Fresnel reflector MACRS: Modified accelerated cost recovery system MENA: Middle East and North Africa NREA: New and renewable energy authority PTC: Parabolic trough collector SAM: Sam advisory model SM: Solar multiple amb: Ambient att: Atmospheric attenuation factor cav: Cavity col: Collector cos: Cosine factor e: Electricity env: Glass envelope hyd: Hydraulic i: Inlet m: Module o: Outlet refl: Mirror reflectivity factor sh&bl: Shadowing and blocking factor t: Thermal tloss : Total loss ? : Efficiency, % ? : Effectiveness
References
- About us | Solargis (n.d.) https://solargis.com/about-us. Accessed 6 Mar 2021
- Aghbashlo M, Tabatabaei M, Rahnama E, Rosen MA (2020) A new systematic decision support framework based on solar extended exergy accounting performance to prioritize photovoltaic sites. J Clean Prod 256:120356. https://doi.org/10.1016/j.jclepro.2020.120356 Article Google Scholar
- Ahmad M, Zeeshan M (2023) Multi-objective optimization of concentrated solar power plants from an energy-water-environment nexus perspective under distinct climatic conditions—Part B: Environ-economic analysis. J Clean Prod 385:135689. https://doi.org/10.1016/J.JCLEPRO.2022.135689 Article Google Scholar
- Aliyu AK, Modu B, Tan CW (2018) A review of renewable energy development in Africa: a focus in South Africa, Egypt and Nigeria. Renew Sustain Energy Rev 81:2502–2518. https://doi.org/10.1016/j.rser.2017.06.055 Article Google Scholar
- Allen RG, Trezza R, Tasumi M (2006) Analytical integrated functions for daily solar radiation on slopes. Agric for Meteorol 139:55–73. https://doi.org/10.1016/j.agrformet.2006.05.012 Article Google Scholar
- Aly A, Jensen SS, Pedersen AB (2017) Solar power potential of Tanzania: identifying CSP and PV hot spots through a GIS multicriteria decision making analysis. Renew Energy 113:159–175. https://doi.org/10.1016/J.RENENE.2017.05.077 Article Google Scholar
- Amani M, Smaili A, Ghenaiet A (2022) A comparative study between two different techniques of solar integrated systems. Appl Therm Eng 211:118478. https://doi.org/10.1016/J.APPLTHERMALENG.2022.118478 Article Google Scholar
- Avila-Marin AL, Fernandez-Reche J, Tellez FM (2013) Evaluation of the potential of central receiver solar power plants: Configuration, optimization and trends. Appl Energy 112:274–288. https://doi.org/10.1016/j.apenergy.2013.05.049 Article Google Scholar
- Baig MH, Surovtseva D, Halawa E (2015) The potential of concentrated solar power for remote mine sites in the Northern Territory, Australia. J Sol Energy 2015:1–10. https://doi.org/10.1155/2015/617356 Article CAS Google Scholar
- Bishoyi D, Sudhakar K (2017) Modeling and performance simulation of 100 MW PTC based solar thermal power plant in Udaipur India, Case Stud. Therm Eng 10:216–226. https://doi.org/10.1016/j.csite.2017.05.005 Article Google Scholar
- Blair N, Dobos AP, Freeman J, Neises T, Wagner M, Ferguson T, Gilman P, Janzou S (2013) System advisor model, SAM 2014.1.14: general description, 2013. www.nrel.gov/publications. Accessed 4 Mar 2021
- Boretti A, Castelletto S, Al-Zubaidy S (2019) Concentrating solar power tower technology: present status and outlook. Nonlinear Eng 8:10–31. https://doi.org/10.1515/nleng-2017-0171 Article Google Scholar
- Boretti A, Nayfeh J, Al-Kouz W (2020) Validation of SAM modeling of concentrated solar power plants. Energies 13:1949. https://doi.org/10.3390/en13081949 Article CAS Google Scholar
- Central Bank of Egypt, Home (n.d.) https://www.cbe.org.eg/en/Pages/default.aspx. Accessed 30 Mar 2021
- Cebecauer T, Suri M (2015) Typical meteorological year data: SolarGIS approach. In: Energy Procedia. Elsevier, pp 1958–1969. https://doi.org/10.1016/j.egypro.2015.03.195
- CERES—Clouds and the Earth’s Radiant Energy System (n.d.). https://ceres.larc.nasa.gov/. Accessed 6 Mar 2021
- Cioccolanti L, Rajabi Hamedani S, Villarini M (2019) Environmental and energy assessment of a small-scale solar Organic Rankine Cycle trigeneration system based on Compound Parabolic Collectors. Energy Convers Manag 198:111829. https://doi.org/10.1016/j.enconman.2019.111829 Article CAS Google Scholar
- Desai NB, Bandyopadhyay S (2015) Integration of parabolic trough and linear Fresnel collectors for optimum design of concentrating solar thermal power plant. Clean Technol Environ Policy 17:1945–1961. https://doi.org/10.1007/s10098-015-0918-9 Article CAS Google Scholar
- Dincer I, Acar C (2015) A review on clean energy solutions for better sustainability. Int J Energy Res 39:585–606. https://doi.org/10.1002/er.3329 Article Google Scholar
- Egypt’s Vision 2030 (n.d.) https://mped.gov.eg/EgyptVision?lang=en. Accessed 19 Feb 2021
- Elshafey S, Shehadeh M, Bayoumi A, Díaz J, Pernía AM, Jose-Prieto MA, Abdelmessih GZ (2018) Solar thermal power in Egypt. In: IEEE industry applications society annual meeting IAS 2018. https://doi.org/10.1109/IAS.2018.8544513
- Fernández AG, Gomez-Vidal J, Oró E, Kruizenga A, Solé A, Cabeza LF (2019) Mainstreaming commercial CSP systems: a technology review. Renew Energy 140:152–176. https://doi.org/10.1016/j.renene.2019.03.049 Article Google Scholar
- Franchini G, Perdichizzi A, Ravelli S, Barigozzi G (2013) A comparative study between parabolic trough and solar tower technologies in Solar Rankine Cycle and Integrated Solar Combined Cycle plants. Sol Energy 98:302–314. https://doi.org/10.1016/j.solener.2013.09.033 Article Google Scholar
- Gadalla M, Saghafifar M (2018) A concise overview of heliostat fields-solar thermal collectors: current state of art and future perspective. Int J Energy Res 42:3145–3163. https://doi.org/10.1002/er.4041 Article Google Scholar
- Hayat MB, Ali D, Monyake KC, Alagha L, Ahmed N (2019) Solar energy—a look into power generation, challenges, and a solar-powered future. Int J Energy Res 43:1049–1067. https://doi.org/10.1002/er.4252 Article Google Scholar
- HelioClim-3 Real Time and Forecast—www.soda-pro.com (n.d.) http://www.soda-pro.com/web-services/radiation/helioclim-3-real-time-and-forecast. Accessed 6 Mar 2021
- Hermann S, Miketa A, Fichaux N (2014) Estimating the renewable energy potential in Africa: a GIS-based approach. https://www.africabib.org/rec.php?RID=383258774. Accessed 23 May 2022
- Hoffmann B, Häfele S, Karl U (2013) Analysis of performance losses of thermal power plants in Germany—a system dynamics model approach using data from regional climate modelling. Energy 49:193–203. https://doi.org/10.1016/J.ENERGY.2012.10.034 Article Google Scholar
- Jorgenson J, Denholm P, Mehos M, Turchi C (2013) Estimating the performance and economic value of multiple concentrating solar power technologies in a production cost model, Golden, CO (United States). https://doi.org/10.2172/1260920
- JRC photovoltaic geographical information system (PVGIS)—European Commission (n.d.) https://re.jrc.ec.europa.eu/pvg_tools/en/#TMY. Accessed 6 Mar 2021
- Menichetti E, El Gharras A, Duhamel B, Karbuz S (2018) The Mena region in the global energy markets, pp 1–39. https://www.iai.it/sites/default/files/menara_wp_21.pdf
- Mohamed ASA, Maghrabie HM (2022) Techno-economic feasibility analysis of Benban solar Park. Alex Eng J 61:12593–12607. https://doi.org/10.1016/J.AEJ.2022.06.034 Article Google Scholar
- Moharram NA, Bayoumi S, Hanafy AA, El-Maghlany WM (2021a) Hybrid desalination and power generation plant utilizing multi-stage flash and reverse osmosis driven by parabolic trough collectors. Case Stud Therm Eng. https://doi.org/10.1016/j.csite.2020.100807 Article Google Scholar
- Moharram NA, Bayoumi S, Hanafy AA, El-Maghlany WM (2021b) Techno-economic analysis of a combined concentrated solar power and water desalination plant. Energy Convers Manag 228:113629. https://doi.org/10.1016/j.enconman.2020.113629 Article Google Scholar
- Moharram NA, Tarek A, Gaber M, Bayoumi S (2022) Brief review on Egypt’s renewable energy current status and future vision. Energy Rep 8:165–172. https://doi.org/10.1016/J.EGYR.2022.06.103 Article Google Scholar
- Morin G, Dersch J, Platzer W, Eck M, Häberle A (2012) Comparison of linear Fresnel and parabolic trough collector power plants. Sol Energy. https://doi.org/10.1016/j.solener.2011.06.020 Article Google Scholar
- Moukhtar I, El Dein AZ, Elbaset AA, Mitani Y (2021) Modelling of a central tower receiver power plant. In: Power system, Springer, pp 57–69. https://doi.org/10.1007/978-3-030-61307-5_3
- New and Renewable Energy Authority (NREA) (n.d.) http://nrea.gov.eg/test/en/Home. Accessed 20 Feb 2021
- NREL, System Advisor Model (SAM) Case Study: Gemasolar, Nrel. (2013), pp 1–10. https://sam.nrel.gov/sites/sam.nrel.gov/files/content/case_studies/sam_case_csp_physical_trough_andasol-1_2013-1-15.pdf. Accessed 14 Mar 2021
- NREL, system advisor model report, Nrel., pp 1–3 (2014). https://sam.nrel.gov/sites/sam.nrel.gov/files/content/case_studies/sam_case_csp_physical_trough_andasol-1_2013-1-15.pdf. Accessed 4 Mar 2021
- SAM CSP Models—System Advisor Model (SAM) (n.d.). https://sam.nrel.gov/concentrating-solar-power.html. Accessed 8 April 2021
- Parameters – Meteonorm (en) (n.d.). https://meteonorm.com/en/meteonorm-parameter. Accessed 6 Mar 2021
- Polo J, Fernández-Peruchena C, Gastón M (2017) Analysis on the long-term relationship between DNI and CSP yield production for different technologies. Sol Energy 155:1121–1129. https://doi.org/10.1016/j.solener.2017.07.059 Article Google Scholar
- Purohit I, Purohit P (2010) Techno-economic evaluation of concentrating solar power generation in India. Energy Policy. https://doi.org/10.1016/j.enpol.2010.01.041 Article Google Scholar
- Rahnama E, Aghbashlo M, Tabatabaei M, Khanali M, Rosen MA (2019) Spatio-temporal solar exergoeconomic and exergoenvironmental maps for photovoltaic systems. Energy Convers Manag 195:701–711. https://doi.org/10.1016/J.ENCONMAN.2019.05.051 Article Google Scholar
- Reddy VS, Kaushik SC, Tyagi SK (2014) Exergetic analysis and economic evaluation of central tower receiver solar thermal power plant. Int J Energy Res 38:1288–1303. https://doi.org/10.1002/er.3138 Article Google Scholar
- Shahrukh Saleem E, ul Asar A (2021) Analysis & Design of parabolic trough solar thermal power plant for typical sites of Pakistan, n.d. www.iosrjournals.orgwww.iosrjournals.org. Accessed 4 Feb 2021
- Shatnawi H, Lim C, Ismail F (2019) Solar tower power: the impact of external receiver on optimal performance and energy storage. Int J Eng Adv Technol 9:4195–4202. https://doi.org/10.35940/ijeat.b4929.129219 Article Google Scholar
- Vasallo MJ, Bravo JM (2016) A MPC approach for optimal generation scheduling in CSP plants. Appl Energy 165:357–370. https://doi.org/10.1016/j.apenergy.2015.12.092 Article Google Scholar
- Wu Y, Zhang B, Wu C, Zhang T, Liu F (2019) Optimal site selection for parabolic trough concentrating solar power plant using extended PROMETHEE method: a case in China. Renew Energy 143:1910–1927. https://doi.org/10.1016/J.RENENE.2019.05.131 Article Google Scholar
- Yang B, Zhao J, Yao W, Zhu Q, Qu H (2010) Feasibility and potential of parabolic trough solar thermal power plants in Tibet of China. In: Asia-Pacific power energy engineering conference APPEEC. https://doi.org/10.1109/APPEEC.2010.5448314
- Zhang HL, Baeyens J, Degrève J, Cacères G (2013) Concentrated solar power plants: review and design methodology. Renew Sustain Energy Rev 22:466–481. https://doi.org/10.1016/j.rser.2013.01.032 Article Google Scholar
- Zhao M, Liu Z, Zhang Q (2009) Feasibility analysis of constructing parabolic trough solar thermal power plant in Inner Mongolia of China. In: Asia-Pacific power energy engineering conference APPEEC. https://doi.org/10.1109/APPEEC.2009.4918378
- Zhu G (2013) Study of the optical impact of receiver position error on parabolic trough collectors. J Sol Energy Eng Trans ASME 135:1–5. https://doi.org/10.1115/1.4024247 Article Google Scholar
Funding
Open access funding provided by The Science, Technology & Innovation Funding Authority (STDF) in cooperation with The Egyptian Knowledge Bank (EKB). No funding.
Author information
Authors and Affiliations
- Mechanical Engineering Department, College of Engineering and Technology, Arab Academy for Science, Technology and Maritime Transport, Alexandria, Egypt S. Bayoumi, N. A. Moharram & A. I. Shehata
- Architectural Engineering Department, Faculty of Engineering, Delta University for Science and Technology, Dakahlia, Egypt M. M. Imam
- Mechanical Engineering Department, Faculty of Engineering, Alexandria University, Alexandria, Egypt W. M. El-Maghlany
Contributions
SB, NAM, AIS: Conceptualization, Methodology and results discussion. WME-M and MMI: Results discussion and paper writing.
Corresponding author
Ethics declarations
Conflict of interest
The authors declare that they have no conflict of interest.
Ethical approval
Approved.
Consent to participate
Approved.
Consent to publication
Approved.
Additional information
Editorial responsibility: Maryam Shabani.
Rights and permissions
Open Access This article is licensed under a Creative Commons Attribution 4.0 International License, which permits use, sharing, adaptation, distribution and reproduction in any medium or format, as long as you give appropriate credit to the original author(s) and the source, provide a link to the Creative Commons licence, and indicate if changes were made. The images or other third party material in this article are included in the article’s Creative Commons licence, unless indicated otherwise in a credit line to the material. If material is not included in the article’s Creative Commons licence and your intended use is not permitted by statutory regulation or exceeds the permitted use, you will need to obtain permission directly from the copyright holder. To view a copy of this licence, visit http://creativecommons.org/licenses/by/4.0/.
About this article
Cite this article
Bayoumi, S., Moharram, N.A., Shehata, A.I. et al. A multi-criteria performance assessment of concentrated solar power plants for site and technology selection in Egypt. Int. J. Environ. Sci. Technol. (2023). https://doi.org/10.1007/s13762-023-05114-1