As an important form of clean energy generation that provides continuous and stable power generation and is grid-friendly, concentrated solar power (CSP) has been developing rapidly in recent years. It is expected that CSP, together with wind energy and solar photovoltaic, will constitute a stable, high percentage of renewable energy generation system that will be price-competitive with conventional energy sources. In this study, a dynamic programming approach based on minimum cost was used to explore the optimal development path of CSP generation in China by 2050. A learning curve model and a technology diffusion model were used as constraints.

The impact of factors such as Gross Domestic Product (GDP) growth, incentive policies, technological advances, grid absorptive capacity, and emission regulation schemes on the development of CSP generation was discussed in the context of sensitivity analysis and scenario comparison. This study has reached the following conclusions: 1) the government cannot achieve the target for cumulative installed capacity in 2050. Considering the interaction of relevant factors, the target would be hard to achieve even under favorable conditions; 2) as a key factor affecting the development of CSP, the incentive policy is closely related to construction cost. It is noteworthy that although the target can be achieved with a higher investment ratio, the CSP industry has failed to create a good ecological environment in the early stage of development; 3) GDP growth and learning rate are important factors influencing the development path in later stages; and 4) although they operate as potential factors affecting construction costs, grid absorptive capacity and carbon permit prices have limited impact on the development of CSP generation.
Introduction
Coping with global climate change and reducing dependence on non-renewable energy sources is of great significance today. Researchers around the world are striving to develop renewable energy to realize sustainable development (Lu et al., 2015). Renewable energy sources mainly include wind, hydro, geothermal, and solar energy, among which solar energy resources have great potential. The total solar radiation energy projected onto the Earth per second is about 5.9 × 10⁶ tons of standard coal equivalent. China enjoys substantial solar energy resources, and the total solar radiation energy at its surface is 1.47 × 10¹⁶ kWh per year (Chen et al., 2017), which is equivalent to 1.7 × 10¹² tons of standard coal (Zhang et al., 2009). The distribution of total solar radiation is uneven: plateaus and arid areas in western China have higher radiation than plains and humid areas in eastern China. The Qinghai–Tibet Plateau has the highest solar radiation density, with total annual radiation levels exceeding 1,800 kWh/m2 and even 2,000 kWh/m2 in some areas,1 indicating that China has a great opportunity to develop solar energy.
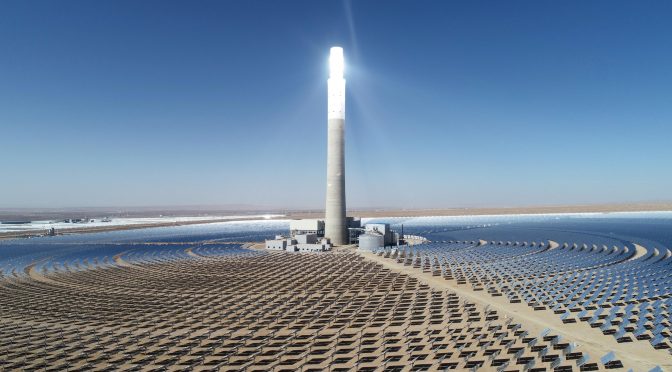
Solar energy is used for power generation in two main ways: photovoltaic (PV) and concentrated solar power (CSP) (Desideri and Campana, 2014). At present, PV technology in China has become mature after decades of development. In 2019, new installed capacity and cumulative installed capacity were both the highest in the world, at 29.56 and 204.6 GW, respectively.2 CSP is the process of converting solar energy into thermal energy, which is then converted into electricity by doing work (Wang et al., 2020). Basically, CSP shares the same power generation principle with fossil-fuel power stations (Liu et al., 2019). The difference is that fossil-fuel power stations use fuels such as coal, oil, and natural gas to generate heat. However, the process produces huge amounts of pollutants (flue gases, dust, sludge, and wastewater). In contrast, CSP generates heat by clean, renewable solar energy. CSP devices can be classified as parabolic troughs, solar towers, linear Fresnel lenses, and parabolic dishes based on the type of reflectors (Wang F. Q. et al., 2017). Parabolic trough concentrated solar power is one of the most developed solar technologies (Gonzalo et al., 2019), accounting for 95.7% of operational CSP projects (Baharoon et al., 2015).
CSP has the following characteristics: 1) it uses solar radiation to generate electricity. Solar energy is the most abundant and widely distributed resource on Earth. 2) Compared with hydropower, CSP faces fewer environmental problems and social objections. Moreover, installed CSP capacity is not constrained by topography. Because CSP facilities are often constructed in desert areas, there is no need to resettle local residents. Furthermore, they can boost the local economy (Chien and Lior, 2011). 3) Unlike wind power, CSP creates no noise pollution. 4) Compared with photovoltaic power generation, CSP has a long service life and is pollution-free (Liu et al., 2019).
The biggest advantage of CSP over other renewable energy sources is its ability to generate electricity in a stable and continuous manner. With reflectors or lenses to concentrate sunlight over a large area into a small light-collecting region, it converts irradiation to heat and then turns heat into electricity by doing work. The excess thermal energy is stored in a medium such as molten salt to generate electricity at night or when solar radiation is low, making CSP grid-friendly (Wang et al., 2020). In addition, from a long-term perspective, CSP can be used as a basic load regulator and can provide a stable and high proportional generation system combined with renewable energy generation technologies such as PV and wind power. Therefore, CSP is a highly competitive power generation technology (Liu et al., 2019).
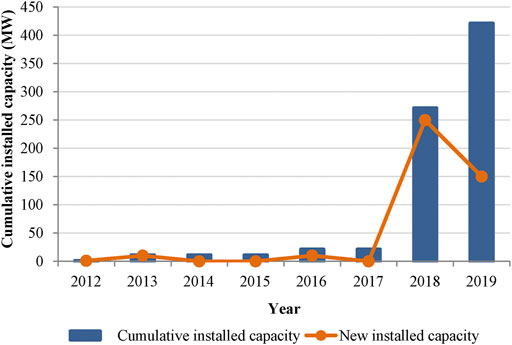
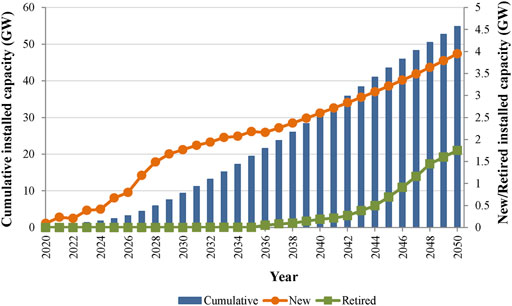
CSP has drawn much attention for its stable power generation. Since 2008, CSP production has accelerated globally (Zhao et al., 2017). Over the past 20 years, approximately 20 solar thermal power plants over 500 kW have been manufactured, and some of these have been commercialized (Liu et al., 2019). Globally, CSP operates on a medium to large scale, with a focus on Spain and the United States (Zhang et al., 2013). By the end of 2019, the total installed global CSP generation capacity reached 6,289 MW, of which Spain accounted for 36.6% and the United States for 28%.2 Due to a late start (the first solar thermal power demonstration projects launched in 2016) (Tang et al., 2018), China accounts for only a small fraction of CSP installations (6.7%).2 However, China takes the lead in terms of CSP capacity under construction and in the planning stage (Zhao et al., 2017). Figure 1 shows new and cumulative installed CSP capacities in China from 2012 to 2019.3 In terms of distribution characteristics, solar thermal power stations in China are distributed over most of northwestern China and in a few areas in North China because of their need for particular natural conditions such as land and light resources. Existing solar thermal power stations are mainly distributed in Qinghai province (Delhi City and Gonghe County) and at Urad Middle Banner in the Inner Mongolia Autonomous Region. Solar thermal power stations under construction or being planned are mainly distributed in Gansu province (Yumen City, Dunhuang city, Aksay Kazakh Autonomous County, Jinta County, and Gulang County), Hami City in the Xinjiang Uygur Autonomous Region, Zhangjiakou city in Hebei province, and Urad Front Banner in the Inner Mongolia Autonomous Region.
FIGURE 1. New and cumulative installed capacities of China’s CSP from 2012 to 2019.
CSP is a promising technology for solar energy utilization with far-reaching implications for China (Yang et al., 2010). However, an efficient and economical thermal energy storage (TES) system is one of the key factors determining the development of this technology (Pelay et al., 2017). CSP plants with large TES can be more economically competitive by generating stable and dispatchable power from intermittent solar energy (Ju et al., 2017). With high penetration of renewable energy, CSP plants with cheap TES will play a key role. However, with its low conversion efficiency of solar energy, the CSP industry in China is still immature (Zhao et al., 2017). High cost is the main factor that hinders its large-scale development. Therefore, developing CSP at minimal cost is important research that can serve as a reference for policy-making.
To accelerate the construction of a clean, low-carbon modern energy system and meet the needs of sustainable economic and social development, China has occasionally adjusted its CSP generation targets. The Medium and Long-term Development Plan of Renewable Energy (National Energy Administration, 2007) requires the cumulative installed capacity of CSP to reach 200 MW by 2020. China’s Renewable Energy Development Roadmap 2050 (Sino-Danish Renewable Energy Development Project Management Office, 2014) proposes that the cumulative installed capacity of CSP will reach 5, 30, and 180 GW by 2020, 2030, and 2050, respectively. The 13th Renewable Energy Development Five-Year Plan (National Energy Administration, 2016) predictes that cumulative installed CSP capacity will reach 13.9 MW in 2015 and 5,000 MW in 2020. Nonetheless, due to insufficient consideration of potential factors affecting CSP development in China and unreasonable targets that could not be optimally achieved, only a few targets were achieved by the end of 2019.
It is very important to forecast CSP investment cost because high cost is the main factor hindering its large-scale development (Zhao et al., 2017). The learning curve model is most commonly used to predict cost reductions (Van der Zwaan and Rabl, 2003; Viebahn et al., 2011). However, few studies have used the learning curve model to forecast cost reduction of CSP. In addition, only a few of the goals proposed have been achieved in China, which may have been due to unreasonable goal setting. Therefore, it is crucial to forecast the development trend of CSP. The technology diffusion model is most commonly used to predict the development trends of renewable energy sources (Kumar and Agarwala, 2016; Fadly and Fontes, 2019), but only a few researchers have predicted CSP development using this model (Xie and Fan, 2017). Furthermore, the goals cannot be achieved in an optimal manner, which may be due to insufficient consideration of potential factors affecting CSP development in China. Dynamic programming, as an optimization method for multi-stage decision problems, is more suitable for studying path-dependent problems under the influence of uncertain factors. Dynamic programming is also widely applied to studies of renewable energy (Lu et al., 2015; Ding et al., 2020; Xu et al., 2020), but rarely to CSP. To narrow these gaps, this study selected a 2050 target of 180 GW and investigated whether it was reasonable, as well as charting the optimal development path of China’s CSP by using dynamic programming based on minimum cost, with a learning curve model and a technology diffusion model used as constraints. The impact of factors such as GDP growth, incentive policies, technological advances, grid absorptive capacity, and emission regulation schemes on the development of CSP generation is discussed in the context of sensitivity analysis and scenario investigation.
The rest of this paper is organized as follows. Literature Review reviews previous research on solar energy, particularly on CSP, and other renewable sources of energy. Model and Hypothesis introduces the research model used in this study and poses hypotheses. The results are presented in Results. Discussions discusses the influence of relevant factors on the CSP development path and makes some suggestions. Finally, Conclusions provide conclusions.
Literature Review
Due to increasingly severe energy shortages and environmental pollution, renewable energy sources are becoming a larger part of the global energy mix, especially in the power industry (Zhang et al., 2017). Therefore, CSP is drawing more attention from experts and researchers. The relevant literature covers several aspects, including cost forecasting as well as diffusion models and integrated utilization of technologies.
Cost is a key constraint to compete with conventional energy sources. Wang (2010) pointed out that significant cost reduction is the crux of market acceptance. Compared with the mature parabolic trough CSP technology, there is potential for the linear Fresnel CSP technology to be cost effective (Sun et al., 2020) due to its simple structure and lesser need for reflectors. The learning curve model proposed by Wright (1936) is most commonly used to predict cost reductions. It has also been widely demonstrated that the cost of products decreases continuously based on economies of scale (Wright, 1936; Yelle, 1979; Wene, 2000), especially in renewable energy generation (Hernández-Moro and Martinez-Duart, 2013). Specifically, this cost reduction can be described as a certain percentage decrease in cost when the cumulative installed capacity is doubled, which is also known as “the learning by doing approach.” The approach assumes that changes in costs are generally attributable to experience, as verified in most of the literature on cost changes in renewable energy (Albrecht, 2007; Köberle et al., 2015; Elshurafa et al., 2018; Hong et al., 2020). Van der Zwaan and Rabl (2003) explored the cost-cutting potential of PV technology in the first decade of the 21st Century through the learning curve model. The same model was used to analyze the cost of CSP plants in Africa and Europe by Viebahn et al. (2011), and the cost reduction curves were derived. Consistently with these papers, this study also adopted the learning curve model to predict the investment cost of CSP generation in China.
Technology diffusion is a subsequent sub-process of the innovation process (Wu et al., 1997), which combines the complex technology with the economy and the market (Cao and Chai, 2013). Renewable energy, as a new form of energy, has a development trend that resembles that for new technology (Lu et al., 2015), with both following the S-shaped growth pattern (Sheng, 2002). Researchers have conducted many studies on renewable energy development based on technology diffusion models. Xie and Fan (2017) built a logistic model to determine the technology maturity of CSP and revealed that the CSP technology was still in the early stage of development. It is expected that global CSP technology will become highly mature and will enter the stage of large-scale commercial application around 2032. Grafström and Lindman (2017) provided a technical development model for economic analysis of the European wind power sector and suggested natural gas prices and feed-in tariffs as crucial factors in the spread of wind power. Other studies have analyzed renewable sources using technology diffusion models (Rao and Kishore, 2010; Popp et al., 2011; Pfeiffer and Mulder, 2013; Kumar and Agarwala, 2016; Fadly and Fontes, 2019). The Bass model plays an important role in the diffusion modeling. Since it was proposed in 1969, it has become the main research tool of market diffusion theory (Yang, 2006). Rao and Kishore (2009) used the Bass model to study the growth patterns of wind power technology in several Indian states; the model which provided a good foundation for the study of capital-intensive equipment such as wind power generators. Radomes and Arango (2015) analyzed the diffusion of photovoltaic systems in Colombia using an extended Bass model in which the adoption rate was a function of promotional activities and social interactions. It can be concluded that technology diffusion modeling is generally mature in renewable energy research based on the above papers, but there is little research about CSP. Yang (2006) pointed out that the fitting result of the Bass model is better than that of the logistic model. Therefore, this study used the Bass model to explore the diffusion path of CSP in China.
Due to the strict data requirements of the Bass model, some studies have focused on parameter estimation methods. Generally speaking, the ordinary least-squares method (Satoh, 2001), the non-linear least-squares method (Wang et al., 2017), the maximum likelihood estimation method (Razo, 2017), the Kalman filtering method (Chow, 2004), and the grey theory method (Wang, 2013) can be used to estimate parameters when data are sufficient, whereas judgment and analogical methods can be used otherwise. However, when using judgment or analogical methods, much external information is required, leading to subjectivity in the estimated parameters. Because CSP development in China started late, this study had insufficient data. Due to the heavy reliance of the accuracy of Bass model prediction on the number of data points (Mahajan et al., 1990), more than 14 data points are usually required to produce reliable statistical results (Zhang, 2006). Yang (2006) indicated that the accuracy of estimating Bass model parameters using a genetic algorithm is higher, which is of great significance for forecasting product diffusion in the growth period. Genetic algorithms (GA), proposed by Holand (1975), are global search methods based on natural selection and genetic variation. Sohn et al. (2009) developed a dynamic pricing model using the Bass model with GA for Korean mobile phone manufactures, and this method was also applied to the optimal electric vehicle charging location problem by Akbari et al. (2018). Similar papers include (Venkatesan and Kumar, 2002; Wang and Chang, 2009; Kong and Bi, 2014). Therefore, the application of GA to estimate the parameters of the Bass model appears to be relatively mature. Hence, GA was used for parameter estimation in this study.
The studies discussed above considered the impacts of cost and technology diffusion on renewable energy development. Other uncertain factors may also influence progress. Therefore, researchers have been investigating the comprehensive development of renewable energy (Xu et al., 2020). For instance, Lund (2007), in a case study in Denmark, discussed the problems and prospects of switching an existing energy systems completely into a renewable energy (wind, solar, wave, and biomass) system. Incentive policies for renewable energy power generation in China were explored by Zhao et al. (2016), including R&D incentives, fiscal and tax incentives, grid-connection and tariff incentives, and market development incentives. The results showed that these policies indeed substantially promoted renewable energy power generation development. Dynamic programming, as an optimization method for multi-stage decision problems, is more suitable for studying path-dependent problems under the influence of uncertain factors. Dynamic programming has also been widely applied to renewable energy studies (Boaro et al., 2012; Marano et al., 2012; Feng et al., 2018; Jafari and Malekjamshidi, 2020). Ding et al. (2020) researched the sensitivity of cost and price elasticity and policy performance to renewable energy technology diffusion by constructing a dynamic programming model. Lu et al. (2015) and Xu et al. (2020) also took these two models as constraints to explore the optimal path of China’s wind power and PV power development, respectively. They both took resource potential, economic development, incentive policies, emission regulatory schemes, and grid absorptive capacity into account. However, few researchers have studied the CSP development path by applying dynamic programming methods.
The studies just described have analyzed the progress of renewable energy from various perspectives, but there have been few studies on CSP, especially on its development path. Therefore, this study draws on the more mature theories and methods to build a dynamic programming model with the goal of cost minimization. Based on the 2050 development target, the optimal development path of CSP in China was studied under the constraints of a learning curve model, a technology diffusion model, economic development, policy incentives, emission regulation schemes, and grid absorptive capacity.
Model and Hypotheses
Learning Curve Model
The learning curve, also known as the experience curve, describes the relationship between cumulative production and unit cost. Previous literature in the field of new energy was principally focused on the one-factor learning curve model (Lu et al., 2015). The functional form can be defined as follows (De La Tour et al., 2013): C(t)=C0×n(t)??×e?t,(1)
where, C(t)
is the unit investment cost for concentrated solar power in year t, C0 is the corresponding cost in the base year, n(t) represents the cumulative installed capacity of CSP at the beginning of the year t, ? is the cumulative installed capacity elasticity coefficient of the unit investment cost, and e?t
is a stochastic error term. PR=2??,(2) LR=1?2??.(3)
The progress ratio (PR) is used to describe the ratio of current unit investment cost to original unit investment cost when cumulative installed capacity doubles; however, the learning rate (LR) is more commonly applied in newer literature (Zhou, 2015). The LR is the learning rate of the learning curve model, which denotes the proportional reduction in unit investment cost associated with a doubling in accumulative installed capacity. For example, if LR = 0.2, it means the unit investment cost will decline by 20% when the cumulative installed capacity is doubled.
Innovation Diffusion Model
The Bass model is a mathematical model proposed by Bass (1969), which represents the macroscopic diffusion process of new products (Cao and Chai, 2013). It was originally designed to predict sales of durable goods and has gradually been applied to the new energy sector. The logistic model and the Gompertz model are also typical S-shaped diffusion curves (Rao and Kishore, 2010). The basic form of these three models is as follows (Lu et al., 2015): dN(t)/dt=F(t)[m?N(t)],(4)
where, m
is the theoretical maximum installed CSP capacity, N(t) is the possible maximum cumulative installed capacity in year t, and F(t)
is a time function determined by the technology diffusion model. The basic form of the Bass model is as follows (Bass, 1969): N(t)´=[p+qmN(t)][m?N(t)].(5)
The Bass model assumes that the adoption of new products is influenced by both external and internal information. External information includes mass media and advertising, for which the effect is represented by p
, and which is called the innovation coefficient; internal information includes social interaction and word-of-mouth, of which the effect is expressed by q
, and which is called the imitation coefficient (Bass, 1969).
Dynamic Programming Model for China’s CSP
It is difficult to study the optimal development path of CSP generation with conventional deterministic prediction methods because solar power forecasting is uncertain (Channon and Eames, 2014). Dynamic programming can decompose a complex multi-stage decision-making problem into a group of simple single-stage sub-problems to solve (Mahmoudimehr and Loghmani, 2016). Generally speaking, the cost of CSP generation consists of investment cost, operation cost, and emissions reduction benefit. Therefore, the total cost function is as follows: TC(S(t),x(t))=C(t)×x(t)+(V?M×L)×n(t)×T,(6)
where, x(t)
is the new installed capacity of China’s CSP in year t and also the decision variable of the dynamic programming model; n(t) is the cumulative installed capacity in year t; S(t) is the state variable, which is equivalent to the cumulative installed capacity gap between the target and n(t); C(t) and V represent the unit investment cost and the unit operating cost of CSP, respectively; T is the annual average operating hours; M is the trading price of the carbon emissions market; and L
is the conversion coefficient between carbon emissions and thermal power generation (Lu et al., 2015).
According to the target proposed in the China Renewable Energy Development Roadmap 2050, cumulative installed CSP capacity will reach 180 GW by 2050. Based on this target, the relationship between S(t)
and n(t)
can be expressed as: S(t)+n(t)=180.(7)
Nowadays, the average service life of a CSP installation is 20 years (Piemonte et al., 2011). It is assumed here that the life cycle of a CSP system follows a uniform distribution ranging from 18 to 22 years. The retired installed capacity is described by the following equation: r(t)=15?22i=18x(t?i).(8)
The state transition equation can then be written as follows: S(t+1)=S(t)?x(t)+r(t).(9)
Therefore, the dynamic programming model of China’s CSP development under the minimum cost can be expressed as: {ft(S(t))=minx(t)?g(S(t)){TC(S(t),x(t))+11+rft+1(S(t+1))}f2051(S(2051))=0,t=2050,…,2020.(10)
Constraints and Parameters
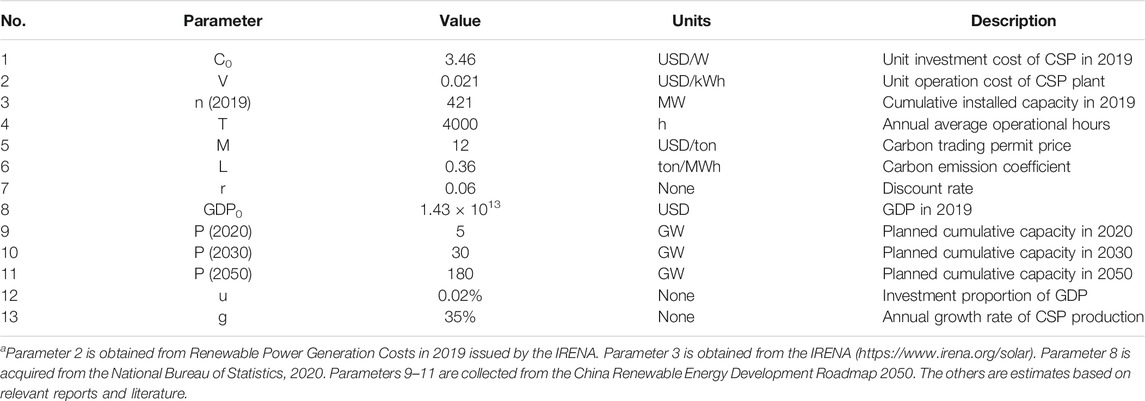
In the past decade, China’s economy has shifted from fast growth to medium-high growth, and the GDP growth rate has gradually decreased from 10 to 6% (Qi and Li, 2020). The impact of COVID-19 reduced China’s GDP growth rate to 2.3% in 2020 (National Bureau of Statistics, 2021). To reflect the moderate slowdown of China’s economic development as well as the impact of the pandemic, the paper refers to Qi and Li (2020) for the GDP growth rate from 2021 to 2050.
As a renewable energy source, CSP is capable of continuous and stable power generation, thus becoming the focus of R&D in some developed countries. The development of CSP technology in China started late, with the first demonstration projects launched in 2016. However, CSP is more competitive than other renewable energy sources due to its low cost, long service life, and stable output power. Nevertheless, incentives and subsidies must be adopted to stimulate CSP development. For this reason, 25.7 billion dollars were invested in China’s solar industry in 2019 (International Renewable Energy Agency, 2020a; International Renewable Energy Agency, 2020b), accounting for 0.18% of GDP. The percentage in 2017 was 0.69%, including 0.01% for CSP investment (International Renewable Energy Agency, 2018). Due to its large planned installed capacity, China is likely to invest more in CSP development. Therefore, the investment ratio for CSP was set at 0.02% of GDP.
The proportion of CSP generation should be continuously increased so that it can become a power source for peak load regulation and intermediate power loads and form a stable and high proportion of a renewable energy power generation system together with wind power and PV power generation to achieve price competitiveness with conventional energy. According to data released by the International Energy Agency, China’s CSP generation reached 300 GWh in 2019, accounting for 0.016% of renewable (non-combustible) power energy generation.4 According to the target proposed in the China Renewable Energy Development Roadmap 2050, electric generation by CSP is expected to reach 720,000 GWh by 2050. Therefore, the annual growth rate of power generation must exceed 28.45% to achieve the above target. With the gradual development of the grid, the growth rate of power connected to the main grid is included in the constraint to reflect the absorptive capacity of the grid. In addition, because of its advantages such as stable and continuous power generation, CSP will certainly become the focus of future development. To reflect this trend, the paper assumed that the grid absorptive capacity would grow at a rate of 35% per year.
In the general debate of the 75th session of the United Nations General Assembly, President Xi Jinping emphasized that China would adopt stronger policies and measures to achieve carbon neutrality by 2060. In 2019, the power sector accounted for more than 40% of the country’s total carbon emissions (National Energy Information Platform, 2020b). Therefore, during the 14th Five-Year Plan period, it is imperative to demonstrate and promote the carbon trading market mechanism in the power industry. The national carbon market is a policy tool based on market mechanisms, and neither a high nor a low carbon price can achieve the most cost-effective emission reductions. The carbon permit price in most Chinese cities (except Beijing) fluctuates between 1.5 and 7.5 USD/ton (Website of Carbon trading, 2020). Because the pressure to reduce emissions is increasing, this study set the price of carbon at 12 USD/ton for the baseline condition.
The related parameters to clarify the above statements are listed in Table 1, which will be used as a base case.
TABLE 1. The parameters in the model.a
In view of the factors just described, the constraints in this model can be expressed as follows: n(t)?N(t),(11) C(t)×x(t)+(V?M×L)×n(t)×T?GDPt×u,(12) (n(t)+x(t)2)×T?(n(t?1)+x(t?1)2)×T×(1+g),(13) C(t)=C0×n(t)??×e?t ,(14) n(t+1)=n(t)+x(t)?r(t),(15) x(t)?0t=2020,…,2050.(16)
Constraint Eq. 11 says that the cumulative installed capacity cannot exceed the possible maximum development potential in year t. Constraint Eq. 12 states that the total investment cost of the newly added capacity cannot surpass a certain percentage of GDP. Constraint Eq. 13 expresses the limitation of grid absorptive capacity to avert explosive growth of CSP. Equality constraint Eq. 14 is a forecast of investment cost, and Eq. 15 is the state transition function of the dynamic programming model. Constraint Eq. 16 expresses a non-negative constraint.
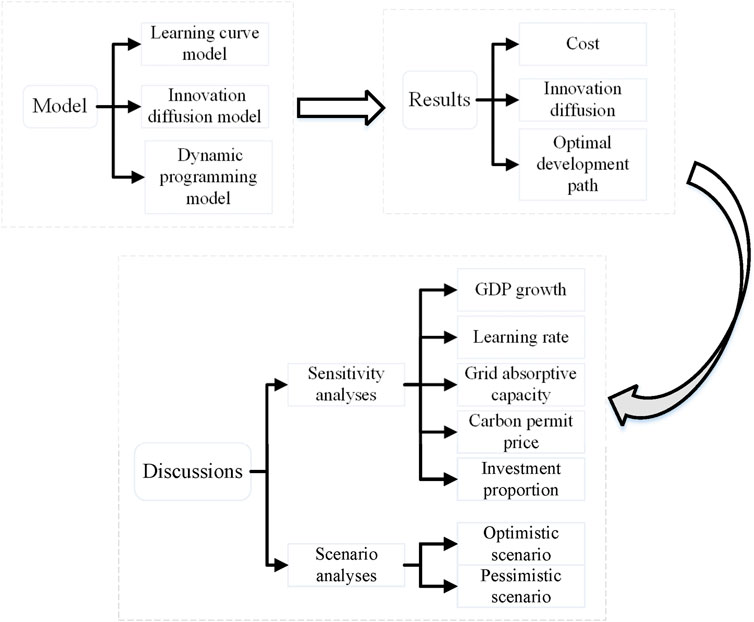
The flowchart of this section and the following two sections (Models, Results, and Discussions) is shown in Figure 2.
FIGURE 2. Flowchart of models, results, and discussions.
Hypotheses
With an increasing share of renewable energy in the grid, energy storage will be a key factor in further decarburization (Pelay et al., 2017). From the perspective of reality, the new energy base of 10 billion watts level will inevitably form a base with integrated wind, PV, and storage and will need to be equipped with flexible regulating power sources such as energy storage. A CSP station is a kind of power source with a regulating ability and a moment of inertia, and its regulating ability is better than battery energy storage. Therefore, CSP is bound to become a focus of future development (National Energy Information Platform, 2020a). However, the actual progress of CSP has not been as fast as expected (Zhao et al., 2017). Further development still needs the guidance and support of the government, which can be reflected through incentive policies. Therefore, this paper hypothesizes that:
H1. Incentive policy is the key factor influencing CSP development.
Next, there is also a close relationship between GDP and social and economic development. The impact of economic development is reflected by analyzing different GDP growth rates (Lu et al., 2015; Xu et al., 2020). The more prosperous the economy, the higher is the GDP growth rate, and the greater will be the investment in CSP. Therefore, this paper proposes that:
H2. GDP growth rate is the key factor that influences CSP development.
Next, installed CSP capacity is small now. However, with large-scale deployment and the accumulation of industry experience, there is still much room to reduce investment cost (International Renewable Energy Agency, 2016). Therefore, the learning rate must necessarily be included in the analysis. Hence, this paper proposes that:
H3. The learning rate is the key factor influencing CSP development in the later phase.
Next, the absorptive capacity of the power grid is also an important factor affecting CSP development (Lu et al., 2015). Insufficient absorptive capacity leads to excess power generation, and excessive construction leads to waste of investment. However, the development of China’s CSP is slow in the early stages, while the development of power grid construction is in step with it. Therefore, the following hypothesis is presented:
H4. The absorptive capacity of the grid is a potential factor influencing construction cost, but has limited impact on CSP development.
With the goal of being carbon-neutral by 2060, the pressure to cut emissions will increase further (Xu et al., 2020). The price of carbon permits directly affects the benefits of emissions reduction and thus the total cost. At present, China’s carbon trading mechanism, relevant laws, and regulations are gradually improving. Therefore, this paper hypothesizes that:
H5. The carbon permit price is a potential factor influencing construction cost, but has limited impact on CSP development.
Results
It is very important to forecast the investment cost of CSP because substantial cost reductions are the key to gaining market acceptance (Wang, 2010), as well as ensuring the rationality of goals due to the small number of stated goals that could be attained in China. Therefore, the results for CSP cost forecasts, development trends, and the optimal development path under minimum cost are discussed in this section.
Cost of CSP
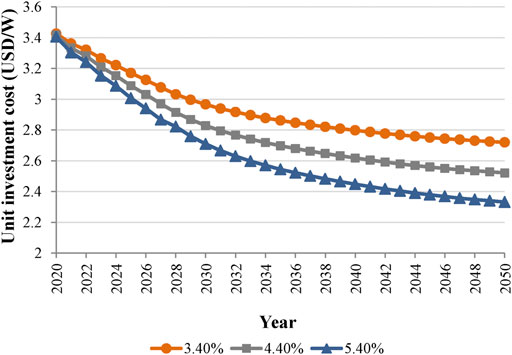
Data for the unit investment cost of CSP generation were derived from statistical reports released by IRENA and adjusted according to the actual situation in China. Table 2 presents the parameter estimation results of the learning curve model. The learning rate LR was 4.4%, which shows that the unit investment cost will decrease by 4.4% for each doubling of CSP cumulative installed capacity. Figure 3 reveals the change in CSP generation cost due to the learning curve model. The cost reduction trend is slowing down, which shows that the effect of experience accumulation on cost reduction is gradually being weakened. The unit investment cost is expected to fall to 2.521 USD/W by 2050, a reduction of 27.14% from the base year. TABLE 2 TABLE 2. Parameter estimation of the learning curve model and innovation diffusion model.
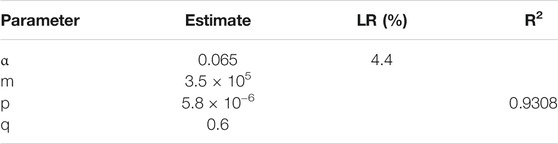
FIGURE 3. Unit investment cost changes under different learning rates.
Innovation Diffusion of CSP Generation Technology
Estimated parameters have been shown in Table 2. It is apparent that the innovation diffusion model fits relatively well with the historical data in Figure 4.
FIGURE 4. Fitted model of cumulative installed capacity.
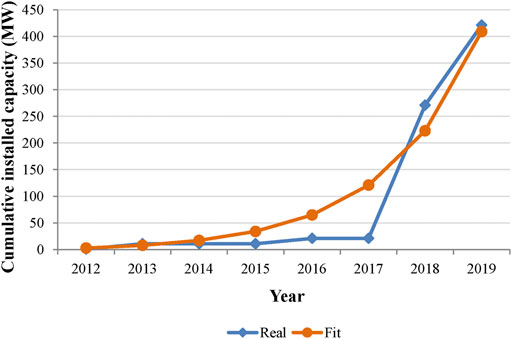
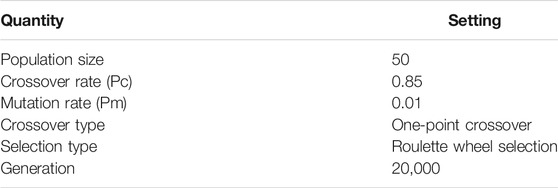
This study used GA to estimate parameters of the Bass model. Correlative matrix is shown in Table 3. Consistently with previous literature, that the innovation coefficient p is far less than the imitation coefficient q (Xu et al., 2020). China’s CSP market potential is about 350 GW, which is far less than the 1357 GW of solar PV power (Xu et al., 2020). This may be the case because CSP is still in its early development stage and the cumulative installed capacity is small in China. Therefore, these historical data led to relatively small results. However, the market potential of 350 GW is higher than the target of 180 GW in 2050, which demonstrates that CSP development in China has a long way to go.
TABLE 3. GA settings.
Optimal Development Path
Figure 5 shows the optimal CSP development path in the base case. Cumulative installed CSP capacity in China will attain 54.84 GW in 2050 under this scenario, which leaves a big gap to reach the target of 180 GW. Furthermore, significant differences exist between forecasts and targets in 2020 and 2030, which illustrates the targets that were established could not be realized. Figure 5 shows that the new installed capacity will increase rapidly before 2030 and then more steadily after 2030. The retired installed capacity will be very small until 2040 due to the small base of new installed capacity before 2020. The retired installed capacity will increase steadily after 2040, keeping in step with previous growth.
FIGURE 5. Optimization path of CSP development in the base case.
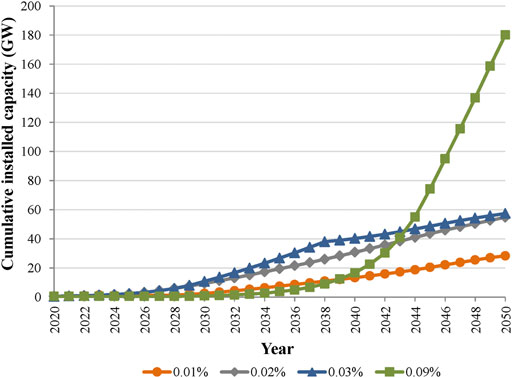
This study investigated a way to achieve the target in 2050 by adjusting parameters. The results show that the goal established for 2050 could be attained if the investment ratio were at least 0.09%. However, it is impossible to realize the stated goal by adjusting other parameters because of the limited impact of these parameters on CSP development (The analysis can be found in Sensitivity Analyses). According to Figure 6, CSP is expected to develop slowly before 2040 and rapidly after 2040 under this investment ratio. One possible reason is that strong government support leads to an influx of numerous investors and fierce market competition, which does not provide a good ecological environment for the CSP industry in the early stage.
FIGURE 6. Cumulative installed CSP capacity under different investment proportions.
Discussions
In addition to the optimal path of CSP development, it is also crucial to study the potential factors affecting its development. The following section describes the application of sensitivity and scenario analyses to explore the key factors impacting CSP development under different conditions. In the various scenarios, there was little difference in the early path, with change occurring mainly in the later period. This conclusion was also reached in previous studies (Xu et al., 2020). Notably, the government’s stated goal is not achieved in any of the following cases.
Sensitivity Analyses
GDP Growth
Based on Qi and Li (2020), China’s GDP growth rate will fall to 3.81% by 2050. This study assumed that the base case GDP growth rate would decline by 0.07% per year from 2019 to 2050. Under the high-speed and low-speed scenarios, the annual growth rate would fall by 0.02 and 0.12%, respectively, which implies that the GDP growth rate would fall to 5.38% and 2.28% by 2050. Figure 7 shows the variation in cumulative installed capacity under different GDP growth rates. The development path is the same under all growth rates until 2035, which implies that the economic growth rate is not a decisive factor for early CSP development. However, the higher the GDP growth rate, the more the cumulative installed capacity grows after 2035. This indicates that economic growth rate is one of the key factors affecting later CSP development, meaning that H2 is partially supported. One reason for this may be that PV power generation in China is in a period of rapid development (Xu et al., 2020), and that CSP is expected to flourish after 2035.
FIGURE 7. Cumulative installed CSP capacity under different GDP growth rates.
Learning Rate
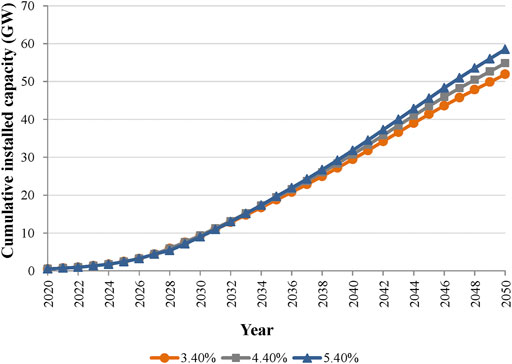
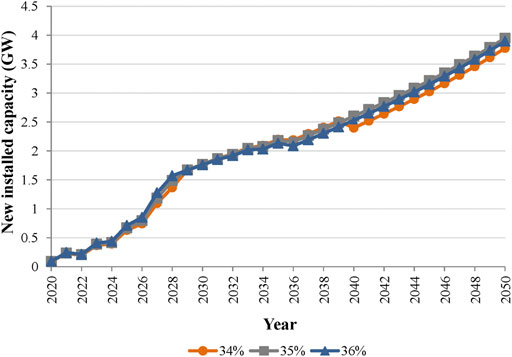
The increase in cumulative installed CSP capacity (i.e., accumulated experience) leads to a decrease in costs according to the learning curve. The learning rate in the base case is 4.4% according to least?squares estimation. Lu et al. (2015) pointed out that the variation would not exceed 2% even if there was a technical breakthrough. Therefore, this study assumed that the variation in learning rate was 1%, that is, the learning rate in the favorable case was 5.4% and in the unfavorable case was 3.4%. Figure 8 shows the variation of the development path for different learning rates. The paths are almost the same in the early stages. However, in the later period, a higher learning rate results in a larger cumulative installed capacity, indicating that learning rate is one of the key factors affecting the development of CSP in the later period, which supports H3. From Figure 3, the unit investment cost in 2050 will drop to 2.72, 2.521, and 2.332 USD/W when the learning rate is 3.4, 4.4, and 5.4%, respectively.
FIGURE 8. Cumulative installed capacity of CSP under different learning rates.
Grid Absorptive Capacity
Previous studies (Lu et al., 2015; Xu et al., 2020) have pointed out that insufficient grid absorptive capacity leads to excess generation and idle power plants, whereas overbuilding the grid results in wasted investment. Due to the large installed CSP capacity planned for the future, this paper has set a higher grid absorptive capacity in the base case, with an annual growth rate of 35%. The variation in the other two cases is 1%. The optimal development paths under different grid absorptive capacities are presented in Figure 9.
FIGURE 9. New installed capacity under different grid absorptive capacities.
The development curves in different periods—before 2025 and from 2029 to 2039—are relatively flat, with essentially the same path for different absorptive capacities. The period 2025–2029 shows slight fluctuations, which implies that grid absorptive capacity is insufficient to keep up with the development of CSP generation. After 2040, the base case develops slightly better than the other two scenarios, indicating that grid absorptive capacity should develop in parallel with CSP generation. Taken together, there is no significant difference in new installed capacity among the three scenarios, and H4 is supported by the indication that grid absorptive capacity has a limited impact on CSP development.
Carbon Permit Price
The carbon permit price in the Chinese market (excluding Beijing) fluctuates between 1.50 and 7.50 USD/ton. With the vision of achieving carbon neutrality by 2060, there is increasing pressure to reduce emissions. Therefore, this study set the price at 12 USD/ton under the base condition, with a variation range of 6 USD/ton.
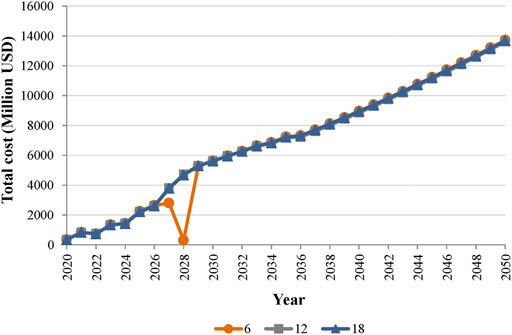
Figure 10 shows the optimal development paths under different carbon permit prices. The path remains the same until 2028, regardless of the changes in carbon permit price. After 2028, higher prices contribute to larger cumulative installed capacity. This indicates that the carbon permit price is one of the factors affecting later development of CSP, but that the impact is limited, which supports H5. The impact of different carbon permit prices on the total cost is shown in Figure 11. Under the unfavorable case, the total cost will fluctuate in 2028 because zero new installed capacity ensures that only operating cost is taken into consideration. Except for 2028, the development paths under different carbon permit prices are basically identical in other years, i.e., the new installed capacity and the cumulative installed capacity are essentially the same each year, and therefore the total costs under various carbon permit prices remain almost unchanged. This also confirms the limited impact of carbon permit prices on CSP development. Overall, total cost is trending upward by 2050, indicating that CSP in China is still immature at this stage and that the emissions reduction benefits are still lower than construction and operating costs.
FIGURE 10. Cumulative installed capacity under different carbon permit prices.
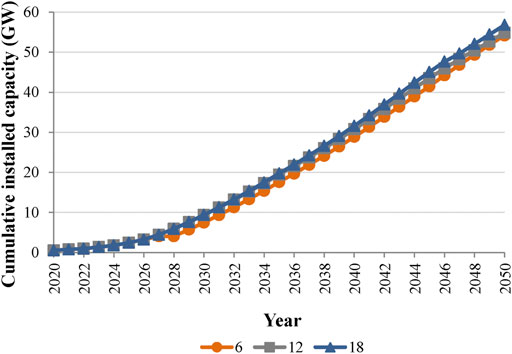
FIGURE 11. Total cost changes under different carbon permit prices.
Investment Proportion
The ratio of CSP investment to GDP can, to some extent, reflect the strength of government incentives. China currently invests a small percentage of GDP in CSP generation, at most 0.01%. Given the huge installed CSP capacity under construction and in the planning stage, it is highly possible that China will increase its investment in CSP. Therefore, in the base case, the investment ratio was set to 0.02%. In the other two cases, the ratios were 0.03 and 0.01%. The optimal development paths under different investment ratios are shown in Figure 6. There is a huge gap in the cumulative installed capacity for different ratios, indicating that strengthening the incentive policy is beneficial to accelerate the achievement of CSP goals. Therefore, H1, stating that incentive policy is the key factor influencing CSP development, is supported. Note that in the unfavorable case, the considerable gaps between cumulative installed capacity and the other two cases indicate that China should invest more to accelerate CSP construction. However, the gap between the base case and the favorable case gradually narrows in the later stage of development, which implies that the incentive effect of the policy gradually diminishes. This is when the influence of other factors such as grid absorptive capacity should be considered.
However, the government can achieve the established target of 180 GW by expanding the investment ratio to a minimum of 0.09%. Note the limited influences of learning rate, power grid absorption capacity, and carbon permit price on CSP development when the investment ratio is 0.09%. However, under this investment ratio, there is an exception that CSP develops steadily when GDP growth rate is low, but rapidly in the later stage when GDP growth rate is high. For higher investment ratio (e.g., 0.17%), the influence of GDP growth rate can be ignored. Therefore, the conclusion can be drawn that as investment in CSP is increased, the influence of all factors will be gradually weakened. (The figures can be seen in Supplementary Materials.)
Scenario Analyses
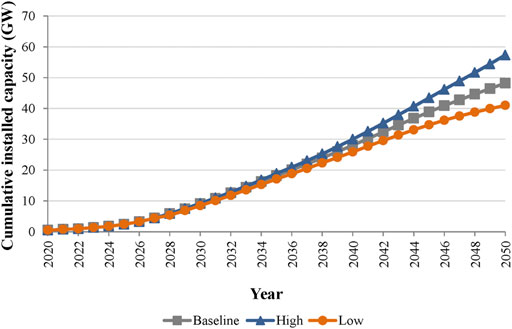
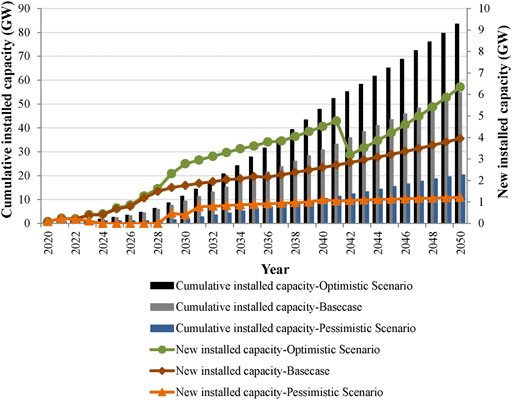
Some other possible development paths are explored in this section. The parameters of all elements are the medium-range values in the basic situation. For the sake of simplification, only two extreme cases are discussed, the optimistic scenario (all favorable conditions) and the pessimistic scenario (all unfavorable conditions). The development paths of the optimistic and pessimistic scenarios are greatly different. Figure 12 shows the optimal CSP development paths under optimistic, basic, and pessimistic scenarios. CSP is predicted to enter a stable and fast growth period from 2042 under the optimistic scenario, but will maintain extremely slow growth from 2031 onward in the pessimistic scenario. Note that the government’s stated target is still not achieved, even under the optimistic scenario. A detailed description and analysis of the development paths in the two scenarios are given in following paragraphs.
FIGURE 12. Comparison of optimistic, basic, and pessimistic scenarios.
Optimistic Scenario
Considering the continuous progress of China’s economy and of CSP technology, the increasing proportion of investment, the steady increase in grid absorptive capacity, and future pressure to reduce emissions, there is a growing call for sustainable development. Therefore, changes in these factors must be considered together. In this section, it is assumed that China’s GDP growth rate will decline at 0.02% per year, the investment ratio will be 0.03%, the learning rate will be 5.4%, the grid absorptive capacity will be 36%, and the carbon emission permit price will be 18 USD/ton.
In the optimistic scenario, CSP development fluctuates in 2042 and then enters a period of steady growth; the process is faster than in the baseline case. Large-scale development starts from 2029. The cumulative installed capacity is expected to reach 83.46 GW by 2050, which is much larger than the 54.84 GW in the baseline case, but still far from the target of 180 GW. Therefore, the government should continue to create a favorable environment for CSP development to achieve the set targets.
Pessimistic Scenario
Contrary to the optimistic scenario, future funding for CSP research and development is likely to decrease in light of mature wind power and PV technologies that are competitive with conventional energy sources. For this reason, a comprehensive analysis of the relevant factors in the pessimistic scenario, i.e., considering all adverse conditions, is crucial. In this section, it is assumed that China’s GDP growth rate decreases at 0.12% per year, the investment ratio is 0.01%, the learning rate is 3.4%, the grid absorption capacity is 34%, and the carbon emission permit price is 6 USD/ton.
In the pessimistic scenario, there is very little new installed capacity until 2028, and even a few years of zero growth. There will be a variation from 2028 to 2031, but after 2031, there will be a stable growth phase with a very low rate compared to the base case. By 2050, the cumulative installed capacity is expected to be 20.24 GW, which is well below the base case. CSP development costs will increase further under unfavorable conditions such as slow economic growth, weakening incentives, and slow grid construction. If the scenario worsens, China’s planned development goals will be even harder to achieve.
Conclusions
Taking the cumulative installed capacity of 180 GW by 2050 as the target, a dynamic programming approach based on minimum cost has been used to explore the optimal development path of CSP generation in China. A learning curve model and a technology diffusion model were adopted as constraints. The impact of related factors is discussed in the context of sensitivity analysis and scenario analysis. The study has reached the following conclusions:
1) In the base case, the government will fail to achieve the set development target, with a projected cumulative installed capacity of 54.84 GW by 2050. New installed capacity will maintain a high growth rate until 2030 and enter a stable growth phase after 2030. The incentive policy is closely related to construction cost, which is the key factor impacting CSP development. Further development of CSP in China still needs guidance and support from the government, but the investment mainly comes from enterprises. Preferential policies will lead to an expanded proportion of investment, which in turn will help the government achieve its development goals more quickly. However, the incentive function of policies will weaken gradually in the later phase. Hence, other influencing factors should be considered, and the incentive policy should be gradually weakened. China’s CSP is expected to usher in rapid development in the later period if the government maintains a more favorable support policy, and then the established goals of the government would be achieved. However, under this policy, market dominance is poor, and other factors have little influence on CSP development.
2) GDP growth rate and learning rate are important factors influencing the development path in the later stages. Affected by the learning curve, the cost decreases in these stages. Fast GDP growth ensures heavy investment in R&D and construction. The higher the learning rate, the easier it is to reach a certain installed capacity target. This indicates that in the later stages of development, industry experience can be accumulated, economies of scale can be realized, and the market will gradually gain more dominance. Grid absorptive capacity and carbon permit prices are potential factors affecting construction costs, but they have limited impact on CSP development, which is a slow process that must be synchronized with grid construction. With the gradual maturity of wind power and PV power generation, China’s carbon trading mechanism and related laws and regulations are also developed gradually and therefore have a limited impact.
3) The scenario analysis shows that even under the optimistic scenario, the government cannot realize the 180 GW development target of cumulative installed capacity by 2050. However, the time required to achieve the target will be shorter than in the base case. This target will be achieved sooner if relevant factors are more favorable, such as better economic development and further increases in investment ratio and R&D funding. On the contrary, in the pessimistic scenario, economic growth will slow down, incentives and R&D will weaken, and the cost of CSP development will further increase. These developments will make the goal more difficult to achieve.
The main contributions of this study are as follows: 1) The impact of realistic factors on economic development is considered. China’s GDP growth rate decreased to 2.3% in 2020 due to the impact of COVID-19. Many projects were put on hold, placing roadblocks in the path of CSP development in China. 2) A genetic algorithm was used to estimate the parameters of the technology diffusion model. By 2019, only eight years of data were available due to the late start of CSP in China. Because the parameter estimation is prone to large bias, using a genetic algorithm makes up for this deficiency and results in more accurate prediction. 3) Unit investment cost data for CSP are extremely hard to obtain. Only global data could be retrieved by consulting a large number of IRENA reports. Therefore, reviewing many references and adjusting global data according to the specific situation of China (e.g., low land acquisition cost, low labor cost) are the best means of estimating the unit investment cost of CSP in China. 4) The path of how to achieve the goal of 180 GW by 2050 and the related influencing factors have been explored.
In addition, the paper is instructive for the development of CSP generation in China, but improvement is still needed. The optimal CSP development path in China by 2050 has been explored with the goal of minimizing cost, and therefore the path may be stable with little variation in the early stages (Xu et al., 2020). Changing the goal, however, will lead to different results. The need remains to improve the accuracy of the forecast parameters (Lu et al., 2015), such as the theoretical maximum installed capacity and the learning rate, which will be improved in further studies.
Data Availability Statement
The original contributions presented in the study are included in the article/Supplementary Material; further inquiries can be directed to the corresponding author.
Author Contributions
Data and review: XZ. Writing and methodology: XD. Proofreading and polishing text: XL.
Conflict of Interest
The authors declare that the research was conducted in the absence of any commercial or financial relationships that could be construed as a potential conflict of interest.
Publisher’s Note
All claims expressed in this article are solely those of the authors and do not necessarily represent those of their affiliated organizations, or those of the publisher, the editors, and the reviewers. Any product that may be evaluated in this article, or claim that may be made by its manufacturer, is not guaranteed or endorsed by the publisher.
Supplementary Material
The Supplementary Material for this article can be found online at: https://www.frontiersin.org/articles/10.3389/fenrg.2021.724021/full#supplementary-material
Footnotes
1The data are collected from National Energy Administration (http://www.nea.gov.cn/2014-08/03/c_133617073.htm) [in Chinese].
2The data are collected from the IRENA (https://www.irena.org/solar).
3The data are collected from the IRENA (https://www.irena.org/solar).
4The data are collected from the IEA (https://www.iea.org/countries/china).
References
Akbari, M., Brenna, M., and Longo, M. (2018). Optimal Locating of Electric Vehicle Charging Stations by Application of Genetic Algorithm. Sustainability 10 (4), 1076. doi:10.3390/su10041076
CrossRef Full Text | Google Scholar
Albrecht, J. (2007). The Future Role of Photovoltaics: A Learning Curve versus Portfolio Perspective. Energ. Pol. 35 (4), 2296–2304. doi:10.1016/j.enpol.2006.07.013
CrossRef Full Text | Google Scholar
Baharoon, D. A., Rahman, H. A., Omar, W. Z. W., and Fadhl, S. O. (2015). Historical Development of Concentrating Solar Power Technologies to Generate Clean Electricity Efficiently – A Review. Renew. Sustain. Energ. Rev. 41, 996–1027. doi:10.1016/j.rser.2014.09.008
CrossRef Full Text | Google Scholar
Bass, F. M. (1969). A New Product Growth for Model Consumer Durables. Manage. Sci. 15 (5), 215–227. doi:10.1287/mnsc.15.5.215
CrossRef Full Text | Google Scholar
Boaro, M., Fuselli, D., Angelis, F. D., Liu, D., Wei, Q., and Piazza, F. (2012). Adaptive Dynamic Programming Algorithm for Renewable Energy Scheduling and Battery Management. Cogn. Comput. 5 (2), 264–277. doi:10.1007/s12559-012-9191-y
CrossRef Full Text | Google Scholar
Cao, X., and Chai, Z, Q. (2013). The Revision of the Process and Model of Technology Diffusion. J. Cent. South. Univ. (Social Science) 19 (4), 14–22. [in Chinese].
Channon, S. W., and Eames, P. C. (2014). The Cost of Balancing a Parabolic Trough Concentrated Solar Power Plant in the Spanish Electricity Spot Markets. Solar Energy 110, 83–95. doi:10.1016/j.solener.2014.08.036
CrossRef Full Text | Google Scholar
Chen, J., Liu, W., Jiang, D., Zhang, J., Ren, S., and Li, L. (2017). Preliminary Investigation on the Feasibility of a Clean CAES System Coupled with Wind and Solar Energy in China. Energy 127, 462–478. doi:10.1016/j.energy.2017.03.088
CrossRef Full Text | Google Scholar
Chien, J. C. L., and Lior, N. (2011). Concentrating Solar thermal Power as a Viable Alternative in China’s Electricity Supply. Energ. Pol. 39 (12), 7622–7636. doi:10.1016/j.enpol.2011.08.034
CrossRef Full Text | Google Scholar
Chow, S. M. (2004). Fitting Linear and Nonlinear Dynamic Models Using Different Kalman Filter Approaches. Charlattesville, VA, United States: University of Virginia. [dissertation/doctor’s thesis].
De La Tour, A., Glachant, M., and Ménière, Y. (2013). Predicting the Costs of Photovoltaic Solar Modules in 2020 Using Experience Curve Models. Energy 62, 341–348. doi:10.1016/j.energy.2013.09.037
CrossRef Full Text | Google Scholar
Desideri, U., and Campana, P. E. (2014). Analysis and Comparison between a Concentrating Solar and a Photovoltaic Power Plant. Appl. Energ. 113, 422–433. doi:10.1016/j.apenergy.2013.07.046
CrossRef Full Text | Google Scholar
Ding, H., Zhou, D., and Zhou, P. (2020). Optimal Policy Supports for Renewable Energy Technology Development: A Dynamic Programming Model. Energy. Econ. 92, 104765. doi:10.1016/j.eneco.2020.104765
CrossRef Full Text | Google Scholar
Elshurafa, A. M., Albardi, S. R., Bigerna, S., and Bollino, C. A. (2018). Estimating the Learning Curve of Solar PV Balance–Of–System for over 20 Countries: Implications and Policy Recommendations. J. Clean. Prod. 196, 122–134. doi:10.1016/j.jclepro.2018.06.016
CrossRef Full Text | Google Scholar
Fadly, D., and Fontes, F. (2019). Geographical Proximity and Renewable Energy Diffusion: An Empirical Approach. Energ. Pol. 129, 422–435. doi:10.1016/j.enpol.2019.02.034
CrossRef Full Text | Google Scholar
Feng, Z., Niu, W., Cheng, C., and Wu, X. (2018). Optimization of Large-Scale Hydropower System Peak Operation with Hybrid Dynamic Programming and Domain Knowledge. J. Clean. Prod. 171, 390–402. doi:10.1016/j.jclepro.2017.09.257
CrossRef Full Text | Google Scholar
Gonzalo, A. P., Marugán, A. P., and Márquez, F. P. G. (2019). A Review of the Application Performances of Concentrated Solar Power Systems. Appl. Energ. 255, 113893. doi:10.1016/j.enpol.2019.02.03410.1016/j.apenergy.2019.113893
CrossRef Full Text | Google Scholar
Grafström, J., and LindmanÅ., (2017). Invention, Innovation and Diffusion in the European Wind Power Sector. Technol. Forecast. Soc. Chang. 114, 179–191. doi:10.1016/j.techfore.2016.08.008
CrossRef Full Text | Google Scholar
Hernández-Moro, J., and Martinez-Duart, J. M. (2013). Analytical Model for Solar PV and CSP Electricity Costs: Present LCOE Values and Their Future Evolution. Renew. Sust. Energ. Rev. 20, 119–132. doi:10.1016/j.rser.2012.11.082
CrossRef Full Text | Google Scholar
Holand, J. H. (1975). Adaptation in Natural and Artificial Systems. Ann Arbour: The University of Michigan Press.
Hong, S., Yang, T., Chang, H. J., and Hong, S. (2020). The Effect of Switching Renewable Energy Support Systems on Grid Parity for Photovoltaics: Analysis Using a Learning Curve Model. Energ. Pol. 138, 111233. doi:10.1016/j.enpol.2019.111233
CrossRef Full Text | Google Scholar
International Renewable Energy Agency. (2018). Global Trends in Renewable Energy Investment 2018. Available at: https://www.fs-unep-centre.org/wp-content/uploads/2019/11/Global_Trends_Report_2018.pdf[accessed October 23, 2020]
International Renewable Energy Agency. (2020a). Global Trends in Renewable Energy Investment 2020. Available at: https://www.fs-unep-centre.org/wp-content/uploads/2020/06/GTR_2020.pdf [accessed October 12, 2020].
International Renewable Energy Agency. (2020b). Renewable Power Generation Costs in 2019. Available at: https://www.irena.org/publications/2020/Jun/Renewable-Power-Costs-in-2019 [accessed October 12, 2020].
International Renewable Energy Agency. (2016). The Power to Change: Solar and Wind Cost Reduction Potential to 2025. Available at: https://www.irena.org/-/media/Files/IRENA/Agency/Publication/2016/IRENA_Power_to_Change_2016.pdf [Accessed October 12, 2020].
Jafari, M., and Malekjamshidi, Z. (2020). Optimal Energy Management of a Residential-Based Hybrid Renewable Energy System Using Rule-Based Real-Time Control and 2D Dynamic Programming Optimization Method. Renew. Energ. 146, 254–266. doi:10.1016/j.renene.2019.06.123
CrossRef Full Text | Google Scholar
Ju, X., Xu, C., Hu, Y., Han, X., Wei, G., and Du, X. (2017). A Review on the Development of Photovoltaic/concentrated Solar Power (PV-CSP) Hybrid Systems. Sol. Energ. Mater. Sol. Cell 161, 305–327. doi:10.1016/j.solmat.2016.12.004
CrossRef Full Text | Google Scholar
Köberle, A. C., Gernaat, D. E., and van Vuuren, D. P. (2015). Assessing Current and Future Techno-Economic Potential of Concentrated Solar Power and Photovoltaic Electricity Generation. Energy 89, 739–756. doi:10.1016/j.energy.2015.05.145
CrossRef Full Text | Google Scholar
Kong, D. Y., and Bi, X. H. (2014). Impact of Social Network and Business Model on Innovation Diffusion of Electric Vehicles in China. Math. Probl. Eng. 2014, 1–7. doi:10.1155/2014/230765
CrossRef Full Text | Google Scholar
Kumar, R., and Agarwala, A. (2016). Renewable Energy Technology Diffusion Model for Techno-Economics Feasibility. Renew. Sust. Energ. Rev. 54, 1515–1524. doi:10.1016/j.rser.2015.10.109
CrossRef Full Text | Google Scholar
Liu, Y., Li, F., Ren, J., Ren, G., Shen, H., and Liu, G. (2019). “Solar thermal Power Generation Technology Research,” in E3S Web of Conferences (Paris, France: EDP Sciences). 136, 02016. doi:10.1051/e3sconf/201913602016
CrossRef Full Text | Google Scholar
Lu, Z. Y., Li, W. H., Xie, B. C., and Shang, L. F. (2015). Study on China’s Wind Power Development Path—Based on the Target for 2030. Renew. Sust. Energ. Rev. 51, 197–208. doi:10.1016/j.rser.2015.06.024
CrossRef Full Text | Google Scholar
Lund, H. (2007). Renewable Energy Strategies for Sustainable Development. Energy 32 (6), 912–919. doi:10.1016/j.energy.2006.10.017
CrossRef Full Text | Google Scholar
Mahajan, V., Muller, E., and Bass, F. M. (1990). New Product Diffusion Models in Marketing: A Review and Directions for Research. J. Marketing. 54 (1), 1–26. doi:10.1177/002224299005400101
CrossRef Full Text | Google Scholar
Mahmoudimehr, J., and Loghmani, L. (2016). Optimal Management of a Solar Power Plant Equipped with a thermal Energy Storage System by Using Dynamic Programming Method. P. Mech. Eng. A-j. Pow. 230 (2), 219–233. doi:10.1177/0957650915619561
CrossRef Full Text | Google Scholar
Marano, V., Rizzo, G., and Tiano, F. A. (2012). Application of Dynamic Programming to the Optimal Management of a Hybrid Power Plant with Wind Turbines, Photovoltaic Panels and Compressed Air Energy Storage. Appl. Energ. 97, 849–859. doi:10.1016/j.apenergy.2011.12.086
CrossRef Full Text | Google Scholar
National Bureau of Statistics. (2020). Statistical Bulletin of the People’s Republic of China on National Economic and Social Development 2019. Available at: http://www.stats.gov.cn/tjsj/zxfb/202002/t20200228_1728913.html [accessed October 10, 2020] [in Chinese].
National Bureau of Statistics. (2021). Statistical Bulletin of the People’s Republic of China on National Economic and Social Development 2020. Available at: http://www.stats.gov.cn/tjsj/zxfb/202102/t20210227_1814154.html [Accessed May 30, 2021] [in Chinese].
National Energy Administration. (2016). The 13th Five-Year Plan in China’s Solar Energy Development (Document Number 2016-354). Available at: http://zfxxgk.nea.gov.cn/auto87/201612/t20161216_2358.htm [accessed October 5, 2020] [in Chinese].
National Energy Administration. (2007). The Medium and Long-Term Development Plan for Renewable Energy (Document Number 2007-2174). Available at: http://www.nea.gov.cn/2007-09/04/c_131053171.htm [accessed October 5, 2020] [in Chinese].
National Energy Information Platform (2020a). Photovoltaic Prospects Are Prosperous, How Will Solar thermal Positioning during the 14th Five-Year Plan. Available at: https://baijiahao.baidu.com/s?id=1685786078064873925&wfr=spider&for=pc [accessed June 1, 2021]. [in Chinese].
National Energy Information Platform (2020b). The Power Industry Is Still the Leader in the Carbon Market during the 14th Five-Year Plan. Available at: https://baijiahao.baidu.com/s?id=1679249561279552185&wfr=spider&for=pc [accessed October 16, 2020] [in Chinese].
Pelay, U., Luo, L., Fan, Y., Stitou, D., and Rood, M. (2017). Thermal Energy Storage Systems for Concentrated Solar Power Plants. Renew. Sust. Energ. Rev. 79, 82–100. doi:10.1016/j.rser.2017.03.139
CrossRef Full Text | Google Scholar
Pfeiffer, B., and Mulder, P. (2013). Explaining the Diffusion of Renewable Energy Technology in Developing Countries. Energ. Econ. 40, 285–296. doi:10.1016/j.eneco.2013.07.005
CrossRef Full Text | Google Scholar
Piemonte, V., De Falco, M., Tarquini, P., and Giaconia, A. (2011). Life Cycle Assessment of a High Temperature Molten Salt Concentrated Solar Power Plant. Sol. Energ. 85 (5), 1101–1108. doi:10.1016/j.solener.2011.03.002
CrossRef Full Text | Google Scholar
Popp, D., Hascic, I., and Medhi, N. (2011). Technology and the Diffusion of Renewable Energy. Energ. Econ. 33 (4), 648–662. doi:10.1016/j.eneco.2010.08.007
CrossRef Full Text | Google Scholar
Qi, Z, H., and Li, B. (2020). Influencing Factors and Re-estimation of China’s Potential Economic Growth under the Background of Globalization. J. Ind. Tech. Econ. 10, 90–99. [in Chinese].
Radomes, A. A., and Arango, S. (2015). Renewable Energy Technology Diffusion: an Analysis of Photovoltaic-System Support Schemes in Medellín, Colombia. J. Clean. Prod. 92, 152–161. doi:10.1016/j.jclepro.2014.12.090
CrossRef Full Text | Google Scholar
Rao, K. U., and Kishore, V. V. N. (2010). A Review of Technology Diffusion Models with Special Reference to Renewable Energy Technologies. Renew. Sust. Energ. Rev. 14 (3), 1070–1078. doi:10.1016/j.rser.2009.11.007
CrossRef Full Text | Google Scholar
Rao, K. U., and Kishore, V. V. N. (2009). Wind Power Technology Diffusion Analysis in Selected States of India. Renew. Energ. 34 (4), 983–988. doi:10.1016/j.renene.2008.08.013
CrossRef Full Text | Google Scholar
Razo, M. (2017). Improved Maximum Likelihood Estimation for Generalized Bass Model. [dissertation/master’s thesis]. Chicago, IL, United States: Illinois Institute of Technology.
Satoh, D. (2001). A Discrete Bass Model and its Parameter Estimation. J. Oper. Res. Soc. Jpn. 44 (1), 1–18. doi:10.15807/jorsj.44.1
CrossRef Full Text | Google Scholar
Sheng, Y. (2002). Technological Innovation Diffusion and New Product Marketing. Beijing: China Development Press. [in Chinese].
Sino-Danish Renewable Energy Development Project Management Office. (2014). China Renewable Energy Development Roadmap 2050. Available at: https://max.book118.com/html/2019/0629/7041141130002035.shtm [accessed October 5, 2020] [in Chinese]
Sohn, S. Y., Moon, T. H., and Seok, K. J. (2009). Optimal Pricing for mobile Manufacturers in Competitive Market Using Genetic Algorithm. Expert Syst. Appl. 36 (2), 3448–3453. doi:10.1016/j.eswa.2008.02.051
CrossRef Full Text | Google Scholar
Sun, J., Zhang, Z., Wang, L., Zhang, Z., and Wei, J. (2020). Comprehensive Review of Line-Focus Concentrating Solar Thermal Technologies: Parabolic Trough Collector (PTC) vs Linear Fresnel Reflector (LFR). J. Therm. Sci. 29 (5), 1097–1124. doi:10.1007/s11630-020-1365-4
CrossRef Full Text | Google Scholar
Tang, N., Zhang, Y., Niu, Y., and Du, X. (2018). Solar Energy Curtailment in China: Status Quo, Reasons and Solutions. Renew. Sust. Energ. Rev. 97, 509–528. doi:10.1016/j.rser.2018.07.021
CrossRef Full Text | Google Scholar
Van der Zwaan, B., and Rabl, A. (2003). Prospects for PV: a Learning Curve Analysis. Sol. Energ. 74 (1), 19–31. doi:10.1016/s0038-092x(03)00112-9
CrossRef Full Text | Google Scholar
Venkatesan, R., and Kumar, V. (2002). A Genetic Algorithms Approach to Growth Phase Forecasting of Wireless Subscribers. Int. J. Forecast. 18 (4), 625–646. doi:10.1016/s0169-2070(02)00070-5
CrossRef Full Text | Google Scholar
Viebahn, P., Lechon, Y., and Trieb, F. (2011). The Potential Role of Concentrated Solar Power (CSP) in Africa and Europe—A Dynamic Assessment of Technology Development, Cost Development and Life Cycle Inventories until 2050. Energ. Pol. 39 (8), 4420–4430. doi:10.1016/j.enpol.2010.09.026
CrossRef Full Text | Google Scholar
Wang, F, Q., Cheng, Z, M., Tan, J, Y., Yuan, Y., Shuai, Y., and Liu, L, H. (2017). Progress in Concentrated Solar Power Technology with Parabolic Trough Collector System: A Comprehensive Review. Renew. Sust. Energ. Rev. 79, 1314–1328. doi:10.1016/j.rser.2017.05.174
CrossRef Full Text | Google Scholar
Wang, F. K., and Chang, K. K. (2009). Modified Diffusion Model with Multiple Products Using a Hybrid GA Approach. Expert Syst. Appl. 36 (10), 12613–12620. doi:10.1016/j.eswa.2009.05.018
CrossRef Full Text | Google Scholar
Wang, Y., Pei, L., and Wang, Z. (2017). The NLS-Based Grey Bass Model for Simulating New Product Diffusion. Int. J. Market. Res. 59 (5), 655–669. doi:10.2501/ijmr-2017-045
CrossRef Full Text | Google Scholar
Wang, Z., Liao, Z., and Zhang, J. (2020). Heliostat-field thermal Mechanics Coupling Design Method of a High-Temperature Collector Field for Next-Generation Solar thermal Power. Scientia Sinica Technologica 50 (10), 1316–1328.
CrossRef Full Text | Google Scholar
Wang, Z. (2010). Prospectives for China’s Solar thermal Power Technology Development. Energy 35 (11), 4417–4420. doi:10.1016/j.energy.2009.04.004
CrossRef Full Text | Google Scholar
Wang, Z. X. (2013). “A New Grey Bass Equation for Modelling New Product Diffusion,” in Applied Mechanics and Materials (Zurich, Switzerland: Trans. Tech. Publications. Ltd), 291, 3033–3036. doi:10.4028/www.scientific.net/amm.291-294.3033
CrossRef Full Text | Google Scholar
Website of Carbon trading (2020) (in Chinese). online. Available at: http://www.tanpaifang.com/(accessed October 16, 2020).
Wene, C. O. (2000). Experience Curves for Energy Technology Policy. Paris: OECD/IEA, 127.
Wright, T. P. (1936). Factors Affecting the Cost of Airplanes. J. Aeronaut. Sci. 3 (4), 122–128. doi:10.2514/8.155
CrossRef Full Text | Google Scholar
Wu, C, Y., Dai, D, S., and Su, J, Q. (1997). Diffusion of Technological Innovation. Beijing: Chemical Industry Press. [in Chinese].
Xie, G, H., and Fan, H. (2017). Prediction Model of Concentrating Solar Power Technology Maturity. J. Shandong. Univ. (Engineering Science). 6, 83–88. doi:10.6040/j.issn.1672-3961.0.2016.480[in Chinese]
CrossRef Full Text | Google Scholar
Xu, M., Xie, P., and Xie, B. C. (2020). Study of China’s Optimal Solar Photovoltaic Power Development Path to 2050. Resour. Pol. 65, 101541. doi:10.1016/j.resourpol.2019.101541
CrossRef Full Text | Google Scholar
Yang, B., Zhao, J., Yao, W., Zhu, Q., and Qu, H. (2010). “March Feasibility and Potential of Parabolic Trough Solar thermal Power Plants in Tibet of China,” in 2010 Asia-Pacific Power and Energy Engineering Conference (IEEE), 1–4.
Yang, J, H. (2006). The Application of Bass Model and its Two Extended Models. [dissertation/doctor’s thesis]. Dalian, China: Dalian University of Technology. [in Chinese].
Yelle, L. E. (1979). The Learning Curve: Historical Review and Comprehensive Survey. Decis. Sci 10 (2), 302–328. doi:10.1111/j.1540-5915.1979.tb00026.x
CrossRef Full Text | Google Scholar
Zhang, B, F. (2006). Econometrics. Beijing: Economic Science Press. [in Chinese].
Zhang, D., Wang, J., Lin, Y., Si, Y., Huang, C., Yang, J., et al. (2017). Present Situation and Future prospect of Renewable Energy in China. Renew. Sust. Energ. Rev. 76, 865–871. doi:10.1016/j.rser.2017.03.023
CrossRef Full Text | Google Scholar
Zhang, H. L., Baeyens, J., Degrève, J., and Cacères, G. (2013). Concentrated Solar Power Plants: Review and Design Methodology. Renew. Sust. Energ. Rev. 22, 466–481. doi:10.1016/j.rser.2013.01.032
CrossRef Full Text | Google Scholar
Zhang, P, D., Yang, Y, L., Shi, L., Zheng, Y, H., Wang, L, S., and Li, X, R. (2009). Opportunities and Challenges for Renewable Energy Policy in China. Renew. Sust. Energ. Rev. 13 (2), 439–449. doi:10.1016/j.rser.2007.11.00
CrossRef Full Text | Google Scholar
Zhao, Z. Y., Chen, Y. L., and Chang, R. D. (2016). How to Stimulate Renewable Energy Power Generation effectively?–China’s Incentive Approaches and Lessons. Renew. Energ. 92, 147–156. doi:10.1016/j.renene.2016.02.001
CrossRef Full Text | Google Scholar
Zhao, Z. Y., Chen, Y. L., and Thomson, J. D. (2017). Levelized Cost of Energy Modeling for Concentrated Solar Power Projects: A China Study. Energy 120, 117–127. doi:10.1016/j.energy.2016.12.122
CrossRef Full Text | Google Scholar
Zhou, L. (2015). Analysis of China Wind Power Cost Based on Multi-Factor Learning Curves. [dissertation/master’s thesis]. Liuzhou, China: Guangxi University of Science and Technology. [in Chinese].
Zhang X, Dong X and Li X (2021) Study of China’s Optimal Concentrated Solar Power Development Path to 2050. Front. Energy Res. 9:724021. doi: 10.3389/fenrg.2021.724021
Reviewed by:
Neeraj Dhanraj Bokde, Aarhus University, Denmark
Lina Xu, Shanxi Datong University, China
Edited by:
Bai-Chen Xie, Tianjin University, ChinaXin Zhang, Xiaojia Dong* and Xinyu Li
- Management School, Tianjin Normal University, Tianjin, China