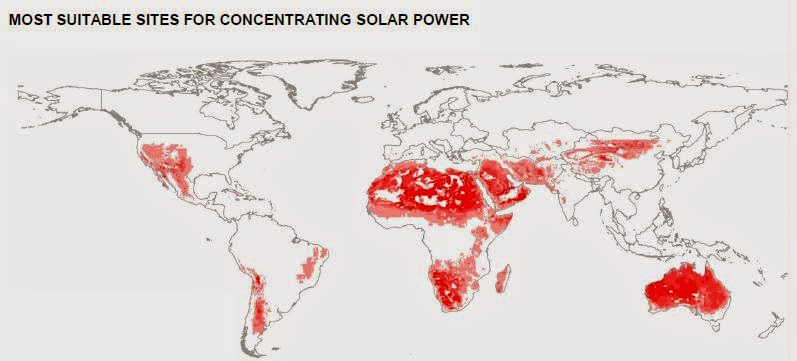
The best sites are between 10° and 40°, South or North. As you can see in the chart below, this makes a huge difference, a CSP in Chile might cost half as much as one in Spain.
 Locating a plant with a solar irradiance of 2,700 kWh/m2 would decrease the generation cost by 25% compared with the same plant with 2,100 kWh/m2. Minimum suitable DNI for CSP is 2000 kWh/m²/year.
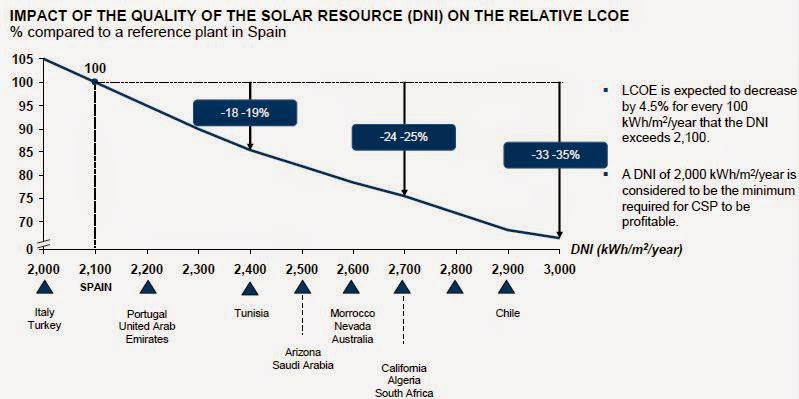
The problem with less than 10° north or south is that the atmosphere is usually too cloudy and wet in summer, and above 40° the weather is too cloudy. DNI is also significantly better at higher altitudes, where absorption and scattering of sunlight are much lower. DNI looks also to be related to land mass, with levels higher over the continent of Africa than the island chains of the Caribbean and Indonesia.
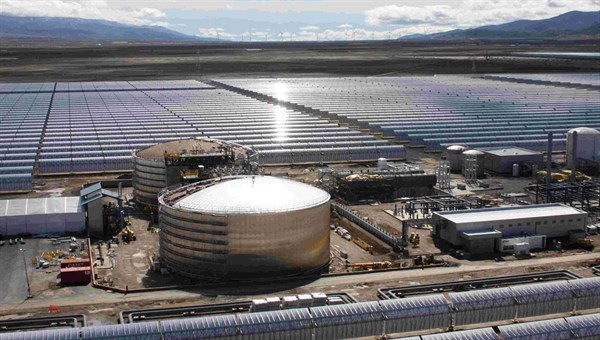
CSP installed capacity was just 4.5 GW at the end of 2014. The US should continue to drive the market, with 3.4 GW of capacity additions by 2017. CSP’s land requirement averages 50 MW per km², midway between solar PV and Wind.
Water use
The best places are deserts where there’s little water. Like any thermal power plant, CSP needs water for cooling processes, which may have a significant environmental impact in arid and semi-arid areas.
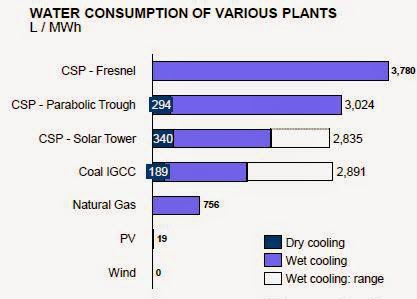
Maximum Water consumption of various plants liters/MWh: 3,780 CSP – Fresnel, 3,024 CSP – Parabolic Trough (294 dry cool), 2,835 CSP – Solar Tower (340 dry cool), 19 Solar PV. Source: CRS (2009), “Water Issues of Concentrating Solar Power (CSP) Electricity in the U.S. Southwest.
The Western Governors’ Association has established a goal of 8 GW by 2015 for solar energy capacity. 15 If this goal is achieved through wet-cooled CSP without storage (i.e., with a 25% capacity factor), the water requirements would be roughly 43 thousand acre-feet per year.If the premium solar sites are selected for these first investments, they likely would be concentrated in Arizona and California. To provide a sense of scale for this water consumption, it can be compared to the overall state-level water consumption. For example, if all of the 8 GW was constructed in Arizona, the increased water demand would represent roughly 1% of the state’s consumptive water use.
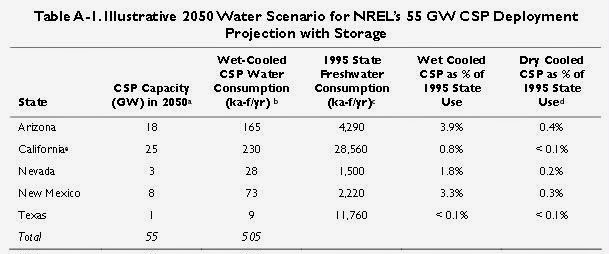
NREL projected as part of its Concentrating Solar Deployment System (CSDS) that 55 GW of CSP would be deployed by 2050 and assumed that the CSP fac ilities would all have six hours of storage. 18 NREL estimated the mean capacity factor for these facilities at 43%. If 55 GW of capacity by 2050 is achieved using wet cooling, the water requirements would be roughly 505 acre feet per year. CSP water use would be less if more water-efficient cooling is employed and if not all the facilities under the 55 GW deployment projection have thermal storage. Alternatively, electricity generated and water use could be higher if 12 hours of thermal storage are employed in some or all facilities.
A Department of Energy (DOE) report, Concentrating Solar Power Commercial Application Study: Reducing Water Consumption of Concentrating Solar Power Electricity Generation , found that dry cooling could reduce water consumption to roughly 80 gal/MWh for solar troughs and 90 gal/MWh for solar towers, compared to the cooling water consumption shown in Table 1. However, DOE also found that electricity generation at a dry-cooled facility dropped off at ambient temperatures above 100°F. Dry cooling, thus, would reduce generation on the same hot days when summer peak electricity demand is greatest. For parabolic troughs in the Southwest, the benefit in the reduction in water consumption from dry cooling resulted in cost increases of 2% to 9% and a reduction in energy generation of 4.5% to 5%. The cost and energy generation penalties for dry cooling depend largely on how much time a facility has ambient temperature above 100°F.
Many of the counties identified as potential locations for CSP also were identified by EPRI as having some level of susceptibility to water supply constraints. The potential use of water by CSP in moderately constrained counties (e.g., Grant and Luna, NM) and in highly constrained counties (e.g., La Paz and Maricopa, AZ) may lead to the adoption of or requirement for more freshwater-efficient CSP facilities. For some Southwest counties with relatively low water use, large-scale deployment of CSP, even with water-efficient cooling technologies, could significantly increase the demand for water in the county (e.g., Grant, NM, and Mineral, NV).
According to NREL’s analysis, significant amounts of the 55 GW generated would be transmitted outside of the CSP-generating states, thereby resulting in a virtual export of the water resources of the producing states to the consuming states. 21 The higher the water consumed per kilowatt-hour, the more the Southwest’s limited water resources would be virtually exported to other regions. The virtual export of water raises policy questions about concentrating electricity generation and its impacts in a few counties and states while its benefits are distributed more broadly. Virtual water imports and exports, however, are not unique to electricity. For example, water is embedded in locally produced agricultural products and manufactured goods that are distributed nationally or globally.
CSP facilities using wet cooling can consume more water per unit of electricity generated than traditional fossil fuel facilities with wet cooling. Options exist for reducing the freshwater consumed by CSP and other thermoelectric facilities. Available freshwater-efficient cooling options, however, often reduce the quantity of electricity produced and increase electricity production costs, and generally do not eliminate water resource impacts.
No water is used or consumed in dry cooling. Air, however, has a much lower capacity to carry heat than water; therefore, dry cooling generally is less efficient than wet cooling in removing heat. 7 Often, massive cooling fans are used to remove the heat from the pipe array in dry cooling. These fans consume a portion of the electricity generated by the power plant. Although dry cooling reduces water use, its consumption of energy for cooling fans and reduction of thermal efficiency of the steam turbines, especially on the hottest days of the year, when summer-peaking utilities most need power, is a significant factor impeding its adoption.
The Electric Power Research Institute (EPRI) developed an index of the susceptibility of U.S. counties to water supply constraints. The index was derived by combining information on the extent of development of available renewable water supply, groundwater use, endangered species, drought susceptibility, estimated growth in water use, and summer deficits in water supply. EPRI produced Figure 1 , which shows the susceptibility to constrained water supplies. Comparing the water constraint index to NREL’s projection of CSP deployment by 2050, in Figure 2, shows overlap, particularly in Arizona and California. NREL’s analysis did not consider water availability as a constraint on CSP deployment.
![]()
Source: Unless otherwise noted, data calculated from DOE, Energy Demands on Water Resources: Report to Congress on the Interdependency of Energy and Water , Dec. 2006. Notes: a. Data is for cooling tower technology, b. DOE, Energy Demands on Water Resources: Report to Congress on the Interdependency of Energy and Water, included some of the other water consumed onsite at the generation facility, but appears not to have captured all of the non-cooling water consumed. Collection and dissemination of data that captures all non-cooling water consumed would improve comparison across technologies. c. DOE, Concentrating Solar Power Commercial Application Study: Reducing Water Consumption of Concentrating Solar Power Electricity Generation (undated) This source captured more of the non-cooling water consumed during generation than the source cited in note b. d. NREL, Fuel from the Sky: Solar Power’s Potential for Western Energy Supply , NREL/SR-550-32160 (July 2002), p. 99. e. CRS provided note. f. Cooling ponds, which are commonly used at nuclear facilities, consume roughly 720 gal/MWh. g. IGCC is Integrated Gasification Combined-Cycle.
Capacity factors for CSP plants with storage are highly uncertain given the early stage of CSP storage technology. As the cost of thermal storage is reduced, future parabolic trough plants could yield capacity factors greater than 70%, competing directly with future baseload combined cycle plants or coal plants. 13 Increased capacity factors mean more energy is generated at a facility, and represent an increase in the quantity of water consumed for each MW of installed capacity. Therefore, without knowing the capacity factor, projections of installed capacity in the Southwest provide incomplete information for producing reliable estimates of the water that may be required for future CSP installations.
This concentration of CSP in a region of the country with water constraints has raised questions about whether, and how, to invest in large-scale deployment of CSP. Most electricity generation requires and consumes water (see Table 1 . Wind is an exception, and PV consumes water only for washing mirrors and surfaces. 11 The water consumed per megawatt- hour (MWh) of electricity produced is referred to as the energy technology’s water intensity.
Why is there concern specifically about the CSP water footprint? CSP using wet cooling (i.e., solar trough and solar tower) consumes more water per MWh than some other generation technologies, as shown in Table 1. The water intensity of electricity from a CSP plant with wet cooling generally is higher than that of fossil fuel facilities with wet cooling. However, its water intensity is less than that of geothermal-produced electricity.
As previously discussed and as shown by comparing the second and third columns in Table 1 , the majority of water consumption at a CSP facility occurs during the cooling process. The fourth column in Table 1 depicts the water consumed in producing the fuel source; this water consumption generally does not occur at the same location as generation. Although CSP cooling technologies are generally the same as those used in traditional thermoelectric facilities, the CSP water footprint is greater due to CSP’s lower net steam cycle efficiency. Options exist for reducing the water consumed by thermoelectric facilities, including CSP facilities; however, with current technology, these options reduce the quantity of energy produced and increase the energy production cost.
A February 2009 memo from the Regional Director of the Pacific West Region of the National Park Service (NPS) to the Acting State Director for Nevada of the Bureau of Land Management illustrates the trend toward more freshwater-efficient cooling. The memo identifies water availability and water rights issues as impacts to be evaluated in permitting of renewable energy projects on federal lands. The memo states: “In arid settings, the increased water demand from concentrating solar energy systems employing water-cooled technology could strain limited water resources already under development pressure from urbanization, irrigation expansion, commercial interests and mining.” 14 The memo also cites rulings in 2001 and 2002 by the Nevada State Engineer identifying reluctance to grant new water rights for water-cooled power plants.
Water consumption refers to water that disappears or is diverted from its source, for example by evaporation, incorporation into crops or industrial processes, drinking water…It is smaller than water withdrawal, which refers to water that is essentially “sucked up” for a given use, but then returned to its source.
Unless dry cooling technology is used, CSP requires a significant volume of water for cooling and condensing processes. But dry cooling is more costly, with efficiency reduced by up to 7% because more energy is required to power the fans and because higher re-cooling temperatures result in higher condensing pressures and temperatures. As a consequence, 2-10% more investment is required to achieve the same annual energy output as a water-cooled system.
Water has several advantages. Direct steam generation, which uses water as the direct working medium rather than oil, allows a higher process temperature and increases efficiency. Higher steam temperature (up to 500°C instead of maximum 390ºC with oil) results in higher efficiency and lower investment and O&M costs due to simpler balance of plant configurations (no need to circulate a second fluid, which in turn reduces pumping power and parasitic losses). And finally, there’s a reduced environmental risks because oil is replaced with water.
CSP 8-10% of global electricity
In the long run, the International Energy Agency (IEA) estimates that CSP would need to meet 8%-10% of global electricity demand by 2050 to limit the average global temperature increase to 2°C, requiring an installed capacity of 800 GW.
By comparison, 2,000 GW of solar PV capacity is required to supply the same amount of electricity. The higher load factor for CSP explains this difference.
For CSP to meet 8% of electricity demand, significant deployment outside the OECD and China would be required. That will require long-distance HVDC transmission lines and add significantly to costs.
The IEA believes the LCOE of CSP would need to fall by more than 75% for their plan to succeed mainly via economies of scale, decrease in component costs and higher efficiency.
There is no aspect of CSP which doesn’t need drastic improvement in cost and performance to make these financially feasible, and research is being done on every component:
Concentrators & receivers: 1) Seek an alternative to conventional rear-silvered glass mirrors (e.g. polymer-based films); 2) Develop a tracking system to track the sun and ensure that reflection is optimized; 3) Improve the solar field set-up.
Heat Fluid Transfer & Storage: 1) Seek new heat transfer fluids and storage media (e.g. phase change material, molten salts); 2) Develop Phase Change thermal storage for all direct steam generation solar plants.
Central receivers: 1) Develop air receivers with Rankine or Brayton cycle; 2) Develop solar tower with ultra/supercritical steam cycle; 3) Develop multi-tower set up.
Develop ground and satellite modeling of solar resources: 1) Improve satellite algorithms to obtain higher spatial resolutions to map high DNI areas better; 2) Develop sensor systems, computing systems and software to optimize sun-tracking systems, adapt to the environment (such as high wind conditions), and to control engine use.
Not fossil free: Almost all existing CSP plants use a back-up fuel (usually natural gas) to substitute or complement thermal storage.
Cost
CSP is a capital-intensive technology. Initial investment, dominated by solar field equipment and labor, ranges from $2,500 to $10,200 USD per kW mainly depending on capacity factor and storage size – and accounts on average for 84% of the electricity generation costs of CSP. The remaining 16% consist mainly of fixed Operation and Maintenance (O&M) costs. Fixed O&M averages around 70 USD per kW per year, while variable maintenance is limited to around 3 USD per MWh.
Although fuel costs are low, Operation & Maintenance (O&M) costs at CSP plants are still significant, at around 30 USD/MWh, the main components are replacing mirrors & receivers due to glass breakage, cleaning the mirrors and insuring the plant.
Depending on the boundary conditions, in particular solar irradiation resource, the levelized cost of electricity (LCOE) from CSP ranges from $140 to $360 USD per MWh.
The Desertec Industrial Initiative is promoting the installation of CSP plants in the sun-rich MENA deserts, with the aim of CSP’s contribution to European electricity supply reaching up to 16% by 2050.
Parabolic Trough 6 to 8h storage: $ 7,100 – 9,800 USD/kW Capital cost, 40% to 53% capacity factor.
Solar Tower 6 to 7.5h storage: $ 6,300 – 7,500 USD/kW Capital cost, 40% to 45% capacity factor.
Solar Tower 12 to 15h storage: $ 9,000 – 10,500 USD/kW Capital cost, 65% to 80% capacity factor.
References
Abengoa Solar – Ch. Breyer and A. Gerlach (2011), “Concentrating Solar Power A Sustainable and Dispatchable Power Option”
Bloomberg New Energy Finance – BNEF (2012), online database
Centro de Investigaciones Energéticas, Medioambientales y Tecnológicas – CIEMAT (2007), “Overview on Direct Steam Generation (DSG)and Experience at the Plataforma Solar de Almería (PSA)”
Chatham House (2009), “Who owns our Low Carbon Future? Intellectual Property and Energy Technologies”
Congressional Research Service (2009), “Water Issues of Concentrating Solar Power (CSP) Electricity in the U.S. Southwest”
Deutsches Zentrum für Luft und Raumfahrt – DLR (2004), “European Concentrated Solar Thermal Road-Mapping”
Desertec Industrial Initiative – DII (2012), “Desert Power 2050: Perspectives on a Sustainable Power System for EUMENA”
European Academies Science Advisory Council – EASAC (2011), “Concentrating solar power: its potential contribution to a sustainable energy future”
European Commission Joint Research Center – EC JRC (2011), “Capacities Map 2011 – Update on the R&D Investment in Three Selected Priority Technologies within the European Strategic Energy Technology Plan: Wind, PV and CSP”
European Solar Thermal Electricity Association – ESTELA (2010), “Solar Thermal Electricity 2025 – Clean electricity on demand: attractive STE cost stabilize energy production”
Intergovernmental Panel on Climate Change –IPCC (2011), “Special report on renewable energy”
International Energy Agency – IEA (2012), “Energy Technology Perspectives 2012”
International Energy Agency – IEA (2011), “Solar Energy Perspectives”
International Energy Agency – IEA (2011), “Annual Report – Implement Agreement on Photovoltaic Power System”
International Energy Agency – IEA (2011), “Harnessing Variable Renewables – A guide to balancing challenge”
International Energy Agency – IEA (2009), “Concentrating Solar Power – Technology Roadmap”
International Renewable Energy Agency – IRENA (2012), “Cost analysis series. Concentrating Solar Power”
International Renewable Energy Agency – IRENA (2012), “Water Desalination Using Renewable Energy – Technology Brief”
Massachusetts Institute of Technology – MIT (2011), “The Future of Electric Grid
Natural Resources Defense Council – NRDC (2012) “Heating Up India’s Solar Thermal Market under the National Solar Mission”
National Renewable Energy Laboratory – NREL (2012), SolarPaces online database (http://www.nrel.gov/csp/solarpaces/by_project.cfm)
United Nations Environment Programme – UNEP (2012), “Global Trends in renewable Investment 2012”
http://www.helioscsp.com/noticia.php?id_not=2898
termosolar, Concentrated Solar Power, Concentrating Solar Power, CSP, Concentrated Solar Thermal Power, solar power, solar energy, DNI, cost, water