Europe’s solar portfolios are still divided over a large number of different owners, but this is a changing landscape. In conjunction with our conference Solar O&M Europe, we have started to create an overview and to map developments in this field, resulting in the attached infographic, which we would like to share with you.
Europe has been leading the path for solar worldwide and is the most mature regional market, with a current installed capacity of over 80 GW (EPIA, Global Market Outlook 2014-2018). Large (institutional) investors are increasingly investing in PV assets and new financing instruments such as Yieldcos successfully provide new sources of capital. All forecasts predict growth which, although not enormous, remains stable for PV in Europe, with PV increasingly replacing conventional means of generating electricity. On the other hand, (retroactive) regulatory changes – most recently in Italy – damage the stability of the market, and hence investors’ trust in solar as an asset class.

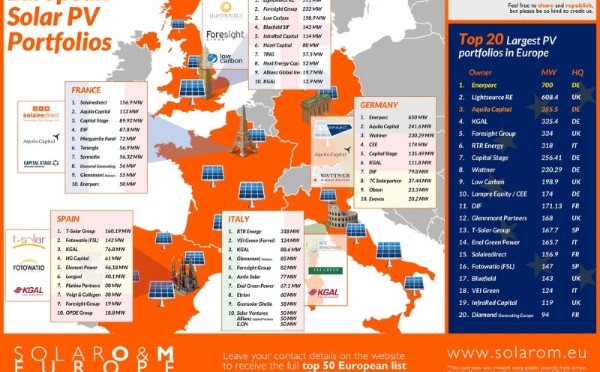
In preparation for Solar O&M Europe, the leading conference on maximising returns from PV assets, we have created an overview of the largest portfolios in Europe, as well as a breakdown per country. The European Top 20 and country Top 10s are visible in the map above. If you’d like to access the full Top 50, please leave your contact details here:
http://www.solaromeurope.com/
Here are some interesting findings that came up:
“The largest portfolios are predominantly located in Germany and the UK”
The 10 largest portfolios are located in Germany (Enerparc, Aquila Capital, Wattner,– 1,121 MWp in total) and the UK (Lightsource, Low Carbon and Bluefield – 946 MWp in total). Spain is represented by the T-Solar and Fotowatio FSL portfolios. RTR Energy makes it into the top 10 on behalf of Italy, and Solairedirect does the same for France.

“The largest portfolios are growing larger”
This is reflected through the numbers provided by the asset owners in the overview: Of the 50 portfolios in the overview, 11 shared their plans for portfolio additions before 2015, totalling a range of 0.8 GW to 1.5 GW. This is due partly to the ongoing consolidation between portfolios (as discussed at our Secondary Markets Conference in July), and partly to the new assets that are constructed (most of them in the UK).
“The level of fragmentation varies a lot per country”
We have attempted to compare different levels of ‘fragmentation’ of PV capacity. Our definition of fragmentation in this case is the level at which the installed capacity in a country is divided over a number of different portfolios. In order to obtain this insight, we have compared the sum of a country’s top 10 largest portfolios with the total – industrial and utility scale – capacity installed in that country (2013 EPIA numbers).
Let’s start with the UK. Although a relatively young market, it already represents 33% of the installed capacity of the 10 largest portfolios in Europe. At the same time, this market seems to have a relatively low fragmentation of portfolios: 68% of the country’s large-scale capacity is represented within these top 10 portfolios in the UK. (If we omit Lightsource, this percentage falls to 39.2%.)
The 10 largest portfolios in France represent 28% of the country’s industrial and large-scale capacity. In Spain this is nearly 18%. Italy and Germany show the highest level of fragmentation: respectively 10.3% and 6.6% of the country’s industrial and large-scale capacity can be found within the 10 largest portfolios in these countries.

“Larger portfolios don’t have to imply larger assets, mostly just more assets”
The 50 largest portfolios consist on average of 30 plants and have an average size of 130 MWp. Narrowing down to the 20 largest portfolios, we note an average number of 51 plants in the portfolio and a total capacity of 244 MWp. The top 10 portfolios register averages of 76 assets and total portfolio size of 341 MWp. Interestingly, the average plant size across these different batches does not differ a great deal (between 4.17 and 4.78 MWp). The graph below shows that the larger portfolios simply pool more assets together, but not necessarily larger assets.

“Average portfolio sizes differ between countries, but the biggest portfolios distort the picture”
Significant differences can be observed from country to country in terms of portfolio size. Looking just at the top 10 portfolios in the largest PV markets, Germany leads the way with an average size of 173 MWp; however, if we do not take into account Enerparc, this average would be significantly lower: 120 MWp.
The UK follows with an average portfolio size of nearly 141 MWp; however if we would not take into account Lightsource RE, this average would also here be significantly lower: 91 MWp.
In third position we find Italy, with an average portfolio size of 99,6 MWp. France and Spain follow at a distance, with an average portfolio size of 78.8 and 63.5 MWp respectively.

“In-house asset management strategy is the standard”
Asset management is more widely taken care of in-house than O&M. 7 out of 10 asset owners with portfolios larger than 100 MW indicate in-house asset management, versus nearly 80% of the smaller portfolio owners. Whether there is a trend in this rather than just interesting numbers will become clear in the following versions of this overview.


“O&M strategy is more often outsourced for portfolios under the 100MW mark than those above”
Several large portfolio owners don’t simply outsource their O&M to a third-party service provider or the EPC responsible for construction; for instance:
– Enerparc and RTR Energy (in-house O&M, no third-party services utilised)
– Lightsource RE (in-house O&M, also third-party services utilised)
– Capital Stage (Capital Stage Solar Services as a subsidiary that acts as an independent O&M provider).
A conclusion that could be drawn from this is that portfolios, once they start to have a critical mass, tend towards in-house O&M. This will definitely form one of the topics of discussion at the conference in October.
Of the asset owners who provided information on their O&M strategy, 60% claim to outsource O&M; 24% handle it themselves; and the remaining 16% indicated to have O&M partially in-house and partially outsourced.
Based on the answers we received, the size of the portfolio seems to have minor impact.
Interestingly, O&M is substantially more often outsourced for portfolios smaller than 100 MWp (67% vs 42% for portfolios >100 MWp). Also, nearly 30% of the portfolios > 100 MWp partially outsource O&M, vs 11% of the smaller portfolios. This would suggest that, for third-party service providers, the largest market opportunities clearly lie in the portfolios of less than 100 MWp.


To download the full Top 50 overview, please follow this link: http://www.solaromeurope.com/