Wind turbine prices have dropped substantially in recent years, despite continued technological advancements that have yielded increases in hub heights and especially rotor diameters.
Berkeley Lab has gathered price data for 96 U.S. wind turbine transactions totaling 26,600 MW announced from 1997 through 2011, including 12 transactions summing to 2,630 MW announced in 2011.
Sources of turbine price data vary, but many derive from press releases and news reports. Wind turbine transactions differ in the services included (e.g., whether towers and installation are provided, the length of the service agreement, etc.), turbine characteristics (and therefore performance), and on the timing of future turbine delivery, driving some of the observed intra-year variability in transaction prices.
Nonetheless, most of the transactions included in the Berkeley Lab dataset likely include turbines, towers, delivery, and limited warranty and service agreements.40 Unfortunately, collecting data on wind turbine transaction prices is a challenge – e.g., the sample of turbine transactions announced in 2011 for which price data were identified represents just 30% of the 8,750 MW of new turbine orders reported by AWEA.
After hitting a low of roughly $700/kW from 2000 to 2002, average wind turbine prices increased by approximately $800/kW (>100%) through 2008, rising to an average of more than $1,500/kW.
The increase in turbine prices over this period was caused by several factors, including: a decline in the value of the U.S. dollar relative to the Euro; increased materials, energy and labor input prices; a general increase in turbine manufacturer profitability due in part to strong demand growth and turbine and component supply shortages; increased costs for turbine warranty provisions; and an up-scaling of turbine size, including hub height and rotor diameter.
A number of turbine transactions announced in 2011 had pricing in the $1,150-$1,350/kW range, while typical turbine prices in the U.S. in the first half of 2012 were reported by Bloomberg NEF to be in the range of $900-$1,270/kW depending on the technology.
These figures suggest price declines of as much as 33% or more since late 2008, with an average decline closer to perhaps 20% for orders announced in 2011.
Moreover, these declines have been coupled with: (1) improved turbine technology (e.g., witness the recent and continued growth in average hub heights and rotor diameters, and (2) more-favorable terms for turbine purchasers (e.g., reduced turbine delivery lead times and less need for large frame-agreement orders, longer initial operations and maintenance (O&M) contract durations, improved warranty terms, and more-stringent performance guarantees).
These price reductions and improved terms would be expected, over time, to exert downward pressure on total project costs and wind power prices, whereas increased rotor diameters and hub heights would be expected to improve capacity factors and further reduce wind power prices.
Though Slow to Reflect Declining Wind Turbine Prices, Reported Installed Project Costs Finally Turned the Corner in 2011.
Berkeley Lab compiles data on the installed cost of wind power projects in the United States, including data on 90 projects completed in 2011 totaling 6,402 MW, or 94% of the wind power capacity installed in that year.
In aggregate, the dataset (through 2011) includes 564 completed wind power projects in the continental United States totaling 40,022 MW, and equaling roughly 85% of all wind power capacity installed in the United States at the end of 2011.
Also reported here are data on a small sample of projects already installed or soon to be installed in 2012 (20 projects totaling 2,592 MW). In general, reported project costs reflect turbine purchase and installation, balance of plant, and any substation and/or interconnection expenses.
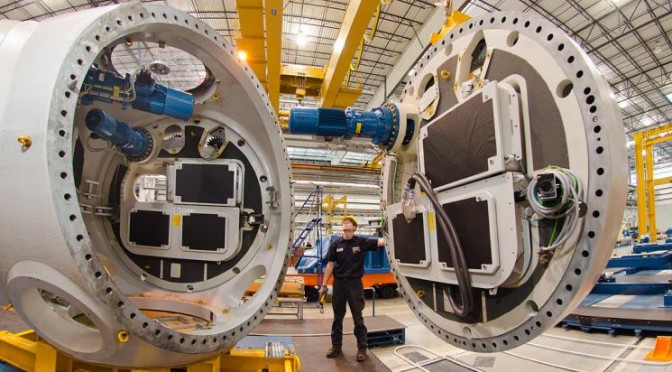
 In Jonesboro, Arkansas, a Nordex USA employee stands between utility-scale components that will eventually make up a completed wind turbine. Under the Recovery Act, Nordex USA received a tax credit to assist in the creation of the Jonesboro manufacturing facility, which opened in October 2010. | Photo courtesy of Nordex USA.
Data sources are diverse, however, and are not all of equal credibility, so emphasis should be placed on overall trends in the data, rather than on individual project-level estimates.
The average installed costs of wind power projects declined dramatically from the beginning of the U.S. wind industry in California in the 1980s through the early 2000s, before following turbine prices higher through the latter part of the last decade.
Whereas turbine prices peaked in 2008/2009, however, installed costs only started to turn the corner in 2011, suggesting 2009/2010 as a likely peak.
That average installed project costs would lag average turbine prices is not surprising, and reflects the normal passage of time between when a turbine supply agreement is signed and when those wind turbines are actually installed and commissioned.
In 2011, the capacity-weighted average installed project cost stood at nearly $2,100/kW, down almost $100/kW from the reported average cost in both 2009 and 2010.
Moreover, a preliminary estimate of the average installed cost among a relatively small sample of 20 projects totaling 2.6 GW of capacity that either have been or will be built in 2012 suggests that average installed costs may decline further in 2012, continuing to follow lower turbine prices.
Installed Costs Differ By Project Size, Turbine Size, and Region
Average installed wind power project costs exhibit weak economies of scale, at least at the low end of the project size range.
Among the sample of projects installed from 2009 through 2011 – there is a steady drop in per-kW average installed costs when moving from projects of 5 MW or less to projects in the 20-50 MW range.
As project size increases beyond 50 MW, however, these data do not show strong evidence of continued economies of scale.
Another way to look for economies of scale is by turbine size (rather than by project size), on the theory that a given amount of wind power capacity may be built less expensively using fewer larger wind turbines as opposed to a larger number of smaller turbines.
Some economies of scale are evident as turbine size increases, at least at the lower end of the turbine size range.
Regional differences in average project costs are also apparent, and may occur due to variations in development costs, transportation costs, siting and permitting requirements and timeframes, and other balance-of-plant and construction expenditures.
Considering only projects in the sample that were installed from 2009 through 2011, the capacity weighted average cost equaled $2,160/kW nationwide over this period.
Texas was the lowest-cost region, while California and New England were the highest-cost regions; all other regions came in close to the nationwide average.
Newer Projects Appear to Show Improvements in Operations and Maintenance Costs
Operations and maintenance (O&M) costs are a significant component of the overall cost of wind energy, but can vary substantially among projects, and market data on actual project-level O&M costs are not readily available.
Even where data are available, care must be taken in extrapolating historical O&M costs given the dramatic changes in wind turbine technology that have occurred over the last two decades, not least of which has been the up-scaling of turbine size.
Anecdotal evidence suggests that O&M costs and premature component failures continue to be key challenges for the wind power industry.
Berkeley Lab has compiled O&M cost data for 133 installed wind power projects in the United States, totaling 7,965 MW of capacity, with commercial operation dates of 1982 through 2010. These data cover facilities owned by both independent power producers and utilities, though data since 2004 are exclusively from utility-owned projects.
A full time series of O&M cost data, by year, is available for only a small number of projects; in all other cases, O&M cost data are available for just a subset of years of project operations. Although the data sources do not all clearly define what items are included in O&M costs, in most cases the reported values include the costs of wages and materials associated with operating and maintaining the facility, as well as rent.
Other ongoing expenses, including general and administrative expenses, taxes, property insurance, depreciation, and workers’ compensation insurance, are generally not included. As such, the following figures are not representative of total operating expenses for wind power projects.
Given the scarcity, limited content, and varying quality of the data, the results that follow therefore may not fully depict the industry’s challenges with O&M issues and expenditures; instead, these results should only be taken as illustrative of overall trends.
Note finally that the available data are presented in $/MWh terms, as if O&M represents a variable cost; in fact, O&M costs are in part variable and in part fixed. Although not presented here, expressing O&M costs in units of $/kW-year yields qualitatively similar results to those presented in this section.
Each project’s O&M costs are depicted in terms of its average annual O&M costs from 2000 through 2011, based on however many years of data are available for that time period. For example, for projects that reached commercial operations in 2010, only year 2011 data are available, and that is what is shown in the figure.
Many other projects only have data for a subset of years during the 2000-11 timeframe, either because they were installed after 2000 or because a full time series is not available, so each data point in the chart may represent a different averaging period over 2000-11.
The chart highlights the 47 projects, totaling 4,339 MW, for which 2011 O&M cost data were available; those projects have either been updated or added.
The data exhibit considerable spread, demonstrating that O&M costs are far from uniform across projects. However, the projects installed more recently have, on average, incurred lower O&M costs.
Specifically, capacity-weighted average 2000-11 O&M costs for the 24 projects in the sample constructed in the 1980s equal $33/MWh, dropping to $23/MWh for the 37 projects installed in the 1990s, and to $10/MWh for the 69 projects installed since 2000.
This drop in O&M costs may be due to a combination of at least two factors: (1) O&M costs generally increase as turbines age, component failures become more common, and manufacturer warranties expire; and (2) projects installed more recently, with larger turbines and more sophisticated designs, may experience lower overall O&M costs on a per-MWh basis.
Limitations in the underlying data, however, do not permit the influence of these two factors to be unambiguously distinguished.
Data for projects under 5 MW in size are excluded, to help control for the confounding influence of economies of scale. Note that, at each project age increment and for each of the two project vintage groups, the number of projects used to compute median annual O&M costs is limited and varies substantially (from 3 to 31 data points per project-year for projects installed from 1998 through 2004 and from 2 to 36 data points per project-year for projects installed from 2005 through 2010).
With this limitation in mind, the figure shows that projects installed more recently (2005-2010) have had, in general, lower O&M costs than those installed in earlier years (1998-2004), at least for the first six years of operation. In addition, projects show an upward trend in project-level O&M costs as they age, though the sample size after year four is limited.
As indicated previously, the data are derived from a variety of sources, and in most cases include only a subset of total operating expenses. In comparison, the financial statements of public companies with sizable U.S. wind project assets indicate markedly higher total operating costs.
Specifically, two companies – Infigen and EDP Renováveis (EDPR), which together represent approximately 4,511 MW of installed capacity, nearly all of which has been installed since 2000 – report total operating expenses of $21.5/MWh and $22.1/MWh, respectively, for their U.S. wind project portfolios in 2011.
These operating expenses are more than twice the $10/MWh reported above, for the 69 projects in the Berkeley Lab data sample installed since 2000. These differences are likely due, in large measure, to the scope of expenses included, as the company financial reports include items such as general and administrative expenses, local taxes, property insurance, and workers’ compensation insurance, which are generally not included within the data comprising the Berkeley Lab sample.